
Disassembling .NET Code with BenchmarkDotNet
Disassembly Diagnoser
Disassembly Diagnoser is the new diagnoser for BenchmarkDotNet that I have just finished. It was released as part of 0.10.10. It allows to disassemble the benchmarked .NET code:
- to ASM:
- desktop .NET: LegacyJit (32 & 64 bit), RyuJIT (64 bit)
- .NET Core 1.1+ (including .NET Core 2.0) for RyuJIT (64 bit)
- Mono: 32 & 64 bit, including LLVM
- to IL and corresponding C# code:
- desktop .NET: LegacyJit (32 & 64 bit), RyuJIT (64 bit)
- .NET Core: 1.1+ (including .NET Core 2.0)
With a single config!
Demo
[DisassemblyDiagnoser(printAsm: true, printSource: true)] // !!! use the new diagnoser!!
[RyuJitX64Job]
public class Simple
{
    int[] field = Enumerable.Range(0, 100).ToArray();

    [Benchmark]
    public int SumLocal()
    {
        var local = field; // we use local variable that points to the field

        int sum = 0;
        for (int i = 0; i < local.Length; i++)
            sum += local[i];

        return sum;
    }

    [Benchmark]
    public int SumField()
    {
        int sum = 0;
        for (int i = 0; i < field.Length; i++)
            sum += field[i];

        return sum;
    }
}
The regular output:
BenchmarkDotNet=v0.10.9.281-nightly, OS=Windows 8.1 (6.3.9600)
Processor=Intel Core i7-4700MQ CPU 2.40GHz (Haswell), ProcessorCount=8
Frequency=2338344 Hz, Resolution=427.6531 ns, Timer=TSC
  [Host]    : .NET Framework 4.7 (CLR 4.0.30319.42000), 64bit RyuJIT-v4.7.2053.0
  RyuJitX64 : .NET Framework 4.7 (CLR 4.0.30319.42000), 64bit RyuJIT-v4.7.2053.0

Job=RyuJitX64  Jit=RyuJit  Platform=X64
| Method | Mean | Error | StdDev |
|---|---|---|---|
| SumLocal | 78.27 ns | 0.6818 ns | 0.6377 ns |
| SumField | 79.24 ns | 0.3923 ns | 0.3670 ns |
And the new disassembly output:
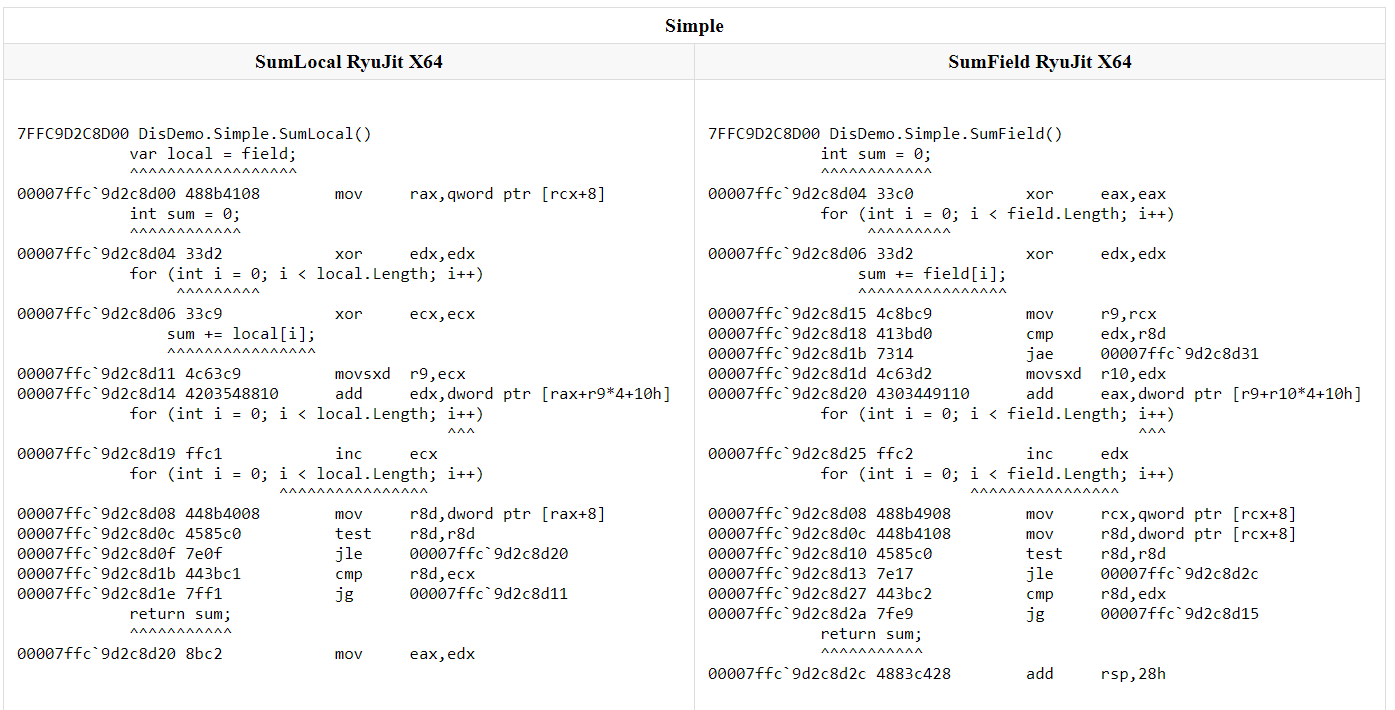
As you can see very similar C# code produces different assembly code which has different performance characteristics. The main goal of disassembly diagnoser is to allow the BenchmarkDotNet users to do an easy comparison of generated assembly code.
The Story
I wanted to develop this feature for a long time. Many people asked for it but I simply did not have any spare time. This was about to change.
I was getting back from an awesome .NET Meetup organized by Karel Zikmund in Prague and I had few spare hours between the checkout from the hotel and my flight. I decided to write a simple PoC and see how it goes.
Initially, I had no idea where to start. Most of the people use the Disassembly window from Visual Studio. But VS is closed-source so I could only use it for validation of my results. The other option was WinDbg. Getting the disassembly with WinDb is non-trivial. And it’s closed-source as well.
I have almost forgotten that Matt Warren did something very similar to this for BenchmarkDotNet a long time ago. I have started analysing his code, which led me to msos by Sasha Goldshtein. And msos by Sasha was exactly what I needed. The credit for super smart disassembling goes to Sasha. I just took his code, tweaked it a little and extended. I have found and fixed some bugs in msos and ClrMD. So all sides benefit from being OSS ;)
How it works?
As some of you might know in BenchmarkDotNet we have the host process (what you run in the console) and child process, which executes the benchmark and reports results back to the host. The child process is generated, compiled and executed by the host. With such architecture, we can benchmark given .NET code for any config desired by the user (any JIT, any .NET framework, any GC configuration). Last but not least it helps to make the results more stable. GC is self-tuning and JIT can make some extra optimizations, but with process per benchmark, you always get the clean score.
Desktop .NET
Based on the idea from msos the host is using ClrMD to attach to the child process. ClrMD allows us to get the text representation of assembly code. To get the IL we use the one and only Mono.Cecil. To get the corresponding C# code we once again use ClrMD.
ClrMD can attach to the process of the same bitness. To support all scenarios (host 32bit, child 64bit and the opposite) I have put the disassembler to a separate process. This is why we have BenchmarkDotNet.Disassembler.x86.exe and BenchmarkDotNet.Disassembler.x64.exe. Both disassemblers are stored in the resources of the BenchmarkDotNet.Core.dll. When the time comes, they are copied from resources to the hard drive and executed accordingly.
.NET Core
The NuGet package of ClrMD implements .NET Core support but targets only desktop .NET. It’s not a problem because we can use our architecture to get it running for .NET Core. Whatever the host is (.NET or .NET Core) it spawns the disassembler process (a desktop .NET process) which uses ClrMD to attach to the child .NET Core process.
This is why we currently support only Windows for our .NET Core disassembler.
Mono
With great help from Miguel de Icaza, I was able to implement a simple disassembler for Mono. We just run:
mono -v -v -v -v --compile $namespace.$typeName:$methodName $exeName
and parse the output. The LLVM is supported and you don’t need to install anything except BenchmarkDotNet. The downside is that as of now the parser can handle only simple benchmarks. I did not have the time to test all edge cases.
Limitations
What we have today comes with following limitations:
- .NET Core disassembler works only on Windows
- Mono disassembler does not support recursive disassembling and produces output without IL and C#.
- Indirect calls are not tracked.
- To be able to compare different platforms, you need to target AnyCPU
<PlatformTarget>AnyCPU</PlatformTarget> - To get the corresponding C#/F# code from disassembler you need to configure your project in following way:
<DebugType>pdbonly</DebugType>
<DebugSymbols>true</DebugSymbols>
How to use it?
The first step is to install BenchmarkDotNet version 0.10.10 or newer (always use latest BenchmarkDotNet for your own good!).
After this you need to apply following settings to your .csproj file:
<PropertyGroup>
  <PlatformTarget>AnyCPU</PlatformTarget>
  <DebugType>pdbonly</DebugType>
  <DebugSymbols>true</DebugSymbols>
</PropertyGroup>
Now you can enable it in two ways:
- Use the new attribute (apply it on a class that contains Benchmarks):
[DisassemblyDiagnoser(printAsm: true, printSource: true)]
public class TheClassThatContainsBenchmarks { /* benchmarks go here */ }
- Tell your custom config to use it:
private class CustomConfig : ManualConfig
{
    public CustomConfig()
    {
        Add(Job.Default);
        Add(DisassemblyDiagnoser.Create(new DisassemblyDiagnoserConfig(printAsm: true, recursiveDepth: 1)));
    }
}
Recursive mode
The new diagnoser supports recursive disassembling. It means that you can configure it to disassemble the benchmark itself and optionally the code that it calls. To do so you need to use the recursiveDepth parameter. Be careful with setting it to int.MaxValue. If you are curious, please try it for following benchmark:
public void Big()
{
   if(new Random(123).Next(5, 10) > 11)
       throw new InvalidOperationException("Impossible");
}
Spoiler: it produces a 50 MB file ;)
Single config for ALL JITs
You can use a single config to compare the generated assembly code for ALL JITs.
But to allow benchmarking any target platform architecture the project which defines benchmarks has to target AnyCPU.
<PropertyGroup>
  <PlatformTarget>AnyCPU</PlatformTarget>
</PropertyGroup>
Let’s check the Devirtualization that was introduced recently for .NET Core 2.0:
public class MultipleJits : ManualConfig
{
    public MultipleJits()
    {
        Add(Job.ShortRun.With(new MonoRuntime(name: "Mono x86", customPath: @"C:\Program Files (x86)\Mono\bin\mono.exe")).With(Platform.X86));
        Add(Job.ShortRun.With(new MonoRuntime(name: "Mono x64", customPath: @"C:\Program Files\Mono\bin\mono.exe")).With(Platform.X64));

        Add(Job.ShortRun.With(Jit.LegacyJit).With(Platform.X86).With(Runtime.Clr));
        Add(Job.ShortRun.With(Jit.LegacyJit).With(Platform.X64).With(Runtime.Clr));

        Add(Job.ShortRun.With(Jit.RyuJit).With(Platform.X64).With(Runtime.Clr));

        // RyuJit for .NET Core 1.1
        Add(Job.ShortRun.With(Jit.RyuJit).With(Platform.X64).With(Runtime.Core).With(CsProjCoreToolchain.NetCoreApp11));

        // RyuJit for .NET Core 2.0
        Add(Job.ShortRun.With(Jit.RyuJit).With(Platform.X64).With(Runtime.Core).With(CsProjCoreToolchain.NetCoreApp20));

        Add(DisassemblyDiagnoser.Create(new DisassemblyDiagnoserConfig(printAsm: true, printPrologAndEpilog: true, recursiveDepth: 3)));
    }
}

[Config(typeof(MultipleJits))]
public class Jit_Devirtualization
{
    private Increment increment = new Increment();

    [Benchmark]
    public int CallVirtualMethod() => increment.OperateTwice(10);

    public abstract class Operation  // abstract unary integer operation
    {
        public abstract int Operate(int input);

        public int OperateTwice(int input) => Operate(Operate(input)); // two virtual calls to Operate
    }

    public sealed class Increment : Operation // concrete, sealed operation: increment by fixed amount
    {
        public readonly int Amount;
        public Increment(int amount = 1) { Amount = amount; }

        public override int Operate(int input) => input + Amount;
    }
}
The results:
BenchmarkDotNet=v0.10.9.281-nightly, OS=Windows 8.1 (6.3.9600)
Processor=Intel Core i7-4700MQ CPU 2.40GHz (Haswell), ProcessorCount=8
Frequency=2338344 Hz, Resolution=427.6531 ns, Timer=TSC
  [Host]     : .NET Framework 4.7 (CLR 4.0.30319.42000), 64bit RyuJIT-v4.7.2053.0
  Job-UBMWVM : .NET Framework 4.7 (CLR 4.0.30319.42000), 64bit LegacyJIT/clrjit-v4.7.2053.0;compatjit-v4.7.2053.0
  Job-JDGXXX : .NET Framework 4.7 (CLR 4.0.30319.42000), 32bit LegacyJIT-v4.7.2053.0
  Job-PXPXXE : .NET Framework 4.7 (CLR 4.0.30319.42000), 64bit RyuJIT-v4.7.2053.0
  Job-DULNTX : .NET Core 1.1.2 (Framework 4.6.25211.01), 64bit RyuJIT
  Job-GAPDXO : .NET Core 2.0.0 (Framework 4.6.00001.0), 64bit RyuJIT
  Job-ZXJTYF : Mono 4.4.1 (Visual Studio), 64bit
  Job-NBVNXQ : Mono 5.2.0 (Visual Studio), 32bit

LaunchCount=1  TargetCount=3  WarmupCount=3
| Method | Jit | Platform | Runtime | Toolchain | Mean | Error | StdDev |
|---|---|---|---|---|---|---|---|
| CallVirtualMethod | LegacyJit | X64 | Clr | Default | 3.222 ns | 0.2984 ns | 0.0169 ns |
| CallVirtualMethod | LegacyJit | X86 | Clr | Default | 3.012 ns | 0.3651 ns | 0.0206 ns |
| CallVirtualMethod | RyuJit | X64 | Clr | Default | 2.928 ns | 0.2941 ns | 0.0166 ns |
| CallVirtualMethod | RyuJit | X64 | Core | .NET Core 1.1 | 2.920 ns | 0.1688 ns | 0.0095 ns |
| CallVirtualMethod | RyuJit | X64 | Core | .NET Core 2.0 | 2.222 ns | 0.6163 ns | 0.0348 ns |
| CallVirtualMethod | RyuJit | X64 | Mono x64 | Default | 5.114 ns | 0.5626 ns | 0.0318 ns |
| CallVirtualMethod | RyuJit | X86 | Mono x86 | Default | 9.610 ns | 0.2672 ns | 0.0151 ns |
The disassembly result can be obtained here. The file was too big to embed it in this blog post.
Getting only the Disassembly without running the benchmarks for a long time
Sometimes you might be interested only in the disassembly, not the results of the benchmarks. In that case you can use Job.Dry which runs the benchmark only once.
public class JustDisassembly : ManualConfig
{
    public JustDisassembly()
    {
        Add(Job.Dry.With(Jit.RyuJit).With(Platform.X64).With(Runtime.Core).With(CsProjCoreToolchain.NetCoreApp20));
        Add(Job.Dry.With(Jit.RyuJit).With(Platform.X64).With(Runtime.Core).With(CsProjCoreToolchain.NetCoreApp21));

        Add(DisassemblyDiagnoser.Create(new DisassemblyDiagnoserConfig(printAsm: true, printPrologAndEpilog: true, recursiveDepth: 3)));
    }
}
The Ultimate Combination
Some time ago I have implemented Hardware Counters diagnoser for BenchmarkDotNet. Ever since then I wanted to combine the Instruction Pointers that comes with the events with the code.
Now it was finally possible. ClrMD gives me the asm with IPs, ETW gives me hardware counters with IPs. That’s all I need.
Let’s use both diagnosers to answer the famous “Why is it faster to process a sorted array than an unsorted array? ”.
class Program
{
    static void Main(string[] args) => BenchmarkRunner.Run<Cpu_BranchPerdictor>();
}

[HardwareCounters(HardwareCounter.BranchMispredictions, HardwareCounter.BranchInstructions)]
[DisassemblyDiagnoser(printAsm: true, printSource: true)]
public class Cpu_BranchPerdictor
{
    private const int N = 32767;
    private readonly int[] sorted, unsorted;

    public Cpu_BranchPerdictor()
    {
        var random = new Random(0);
        unsorted = new int[N];
        sorted = new int[N];
        for (int i = 0; i < N; i++)
            sorted[i] = unsorted[i] = random.Next(256);
        Array.Sort(sorted);
    }

    private static int Branch(int[] data)
    {
        int sum = 0;
        for (int i = 0; i < N; i++)
            if (data[i] >= 128)
                sum += data[i];
        return sum;
    }

    [Benchmark]
    public int SortedBranch() => Branch(sorted);

    [Benchmark]
    public int UnsortedBranch() => Branch(unsorted);
}
The results:
BenchmarkDotNet=v0.10.9.281-nightly, OS=Windows 8.1 (6.3.9600)
Processor=Intel Core i7-4700MQ CPU 2.40GHz (Haswell), ProcessorCount=8
Frequency=2338344 Hz, Resolution=427.6531 ns, Timer=TSC
  [Host]     : .NET Framework 4.7 (CLR 4.0.30319.42000), 64bit RyuJIT-v4.7.2053.0
  DefaultJob : .NET Framework 4.7 (CLR 4.0.30319.42000), 64bit RyuJIT-v4.7.2053.0
| Method | Mean | Error | StdDev | Mispredict rate | BranchInstructions/Op | BranchMispredictions/Op |
|---|---|---|---|---|---|---|
| SortedBranch | 21.15 us | 0.0550 us | 0.0488 us | 0,11% | 61712 | 65 |
| UnsortedBranch | 135.32 us | 0.7503 us | 0.7018 us | 21,90% | 80158 | 17555 |
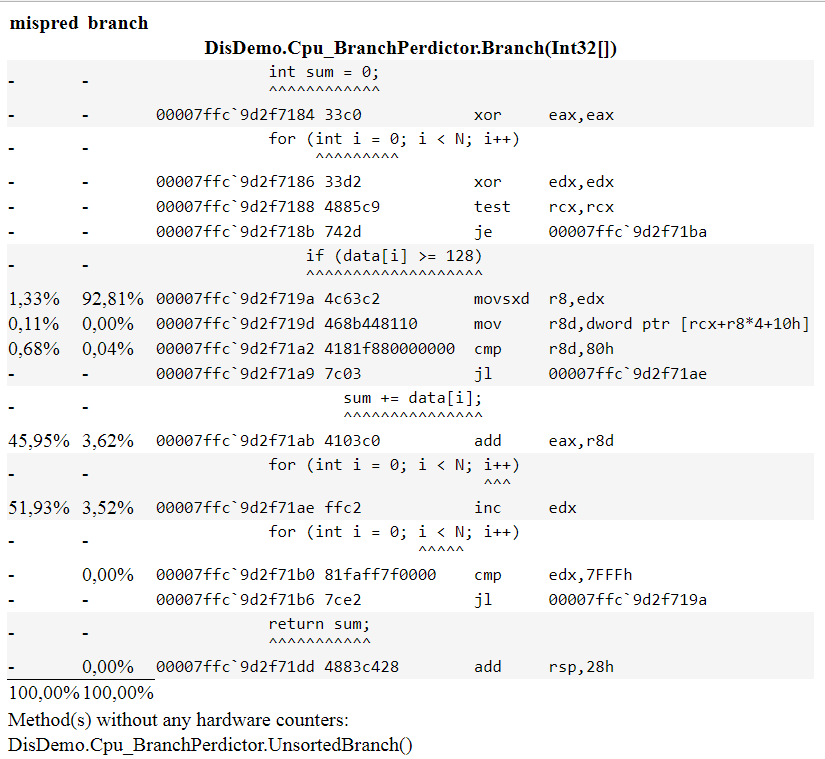
The new report:
How it works
When we attach with ClrMD to the benchmarked process we ask it for the asm instructions for given address. The address is Instruction Pointer (IP).
The other diagnoser is using ETW to gather the PMC events. Each event comes with hardware counter type, interval, Instruction Pointer and process Id.
When we detect that user is using both diagnosers we enable Instruction Pointer exporter. It eliminates the noise (events with IPs that don’t belong to the benchmarked code like BenchmarkDotNet engine) and aggregates the results.
Skid
Please keep in mind that we just show what we get. The PMC events are usually delayed. They are collected in Event-Based Sampling (EBS) mode. When the event occurs, the counter increments and when it reaches the max interval value the event is fired with current Instruction Pointer (good explanation). We try to overcome the side effects of this by running a lot of iterations of the benchmarked code. If your processor support PEBS it should also help.
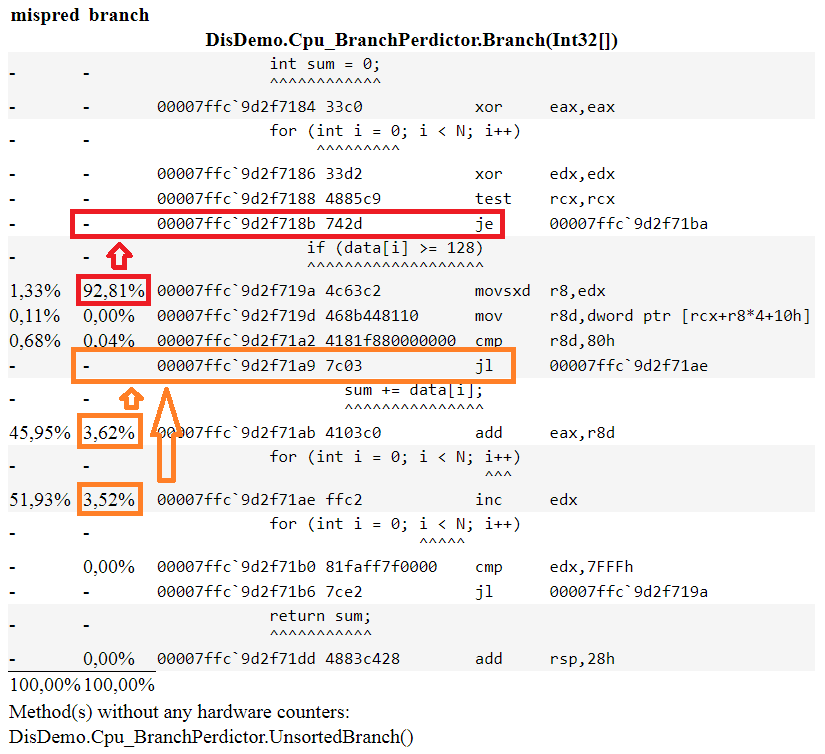
As you can see instructions without branches report branching events. I used arrows to show the real instructions for each branch.
If you are interested to learn more about skid testing I encourage you to try simple but very smart “Processor PMC event skid testing” by Brendan Gregg. In his case it was over 99% skids.