
Profiling Concurrent .NET Code with BenchmarkDotNet and visualizing it with Concurrency Visualizer
Concurrency Visualizer Profiler
ConcurrencyVisualizerProfiler is the new diagnoser for BenchmarkDotNet that I have implemented some time ago. It was released as part of 0.11.3. It allows to profile the benchmarked .NET code on Windows and exports the data to a trace file which can be opened with Concurrency Visualizer (plugin for Visual Studio, used to be a part of it).
Again with a single config!
Demo
Following code is a real-world benchmark from the ML.NET repository
[ConcurrencyVisualizerProfiler] // !!! use the new diagnoser!!
public class MultiClassClassificationTrain
{
    [Benchmark]
    public void CV_Multiclass_WikiDetox_WordEmbeddings_OVAAveragedPerceptron()
    {
        string cmd = @"CV k=5  data=" + _dataPath_Wiki +
            " tr=OVA{p=AveragedPerceptron{iter=10}}" +
            " loader=TextLoader{quote=- sparse=- col=Label:R4:0 col=rev_id:TX:1 col=comment:TX:2 col=logged_in:BL:4 col=ns:TX:5 col=sample:TX:6 col=split:TX:7 col=year:R4:3 header=+}" +
            " xf=Convert{col=logged_in type=R4}" +
            " xf=CategoricalTransform{col=ns}" +
            " xf=TextTransform{col=FeaturesText:comment tokens=+ wordExtractor=NGramExtractorTransform{ngram=2}}" +
            " xf=WordEmbeddingsTransform{col=FeaturesWordEmbedding:FeaturesText_TransformedText model=FastTextWikipedia300D}" +
            " xf=Concat{col=Features:FeaturesText,FeaturesWordEmbedding,logged_in,ns}";

        using (var environment = EnvironmentFactory.CreateClassificationEnvironment<TextLoader, CategoricalTransform, AveragedPerceptronTrainer>())
        {
            Maml.MainCore(environment, cmd, alwaysPrintStacktrace: false);
        }
    }
}
The regular output (last two lines are the most important here):
BenchmarkDotNet=v0.11.3, OS=Windows 10.0.17763.107 (1809/October2018Update/Redstone5)
Intel Xeon CPU E5-1650 v4 3.60GHz, 1 CPU, 12 logical and 6 physical cores
.NET Core SDK=3.0.100-alpha1-009697
  [Host]     : .NET Core 2.1.5 (CoreCLR 4.6.26919.02, CoreFX 4.6.26919.02), 64bit RyuJIT
  Job-GAEOXF : .NET Core 2.1.5 (CoreCLR 4.6.26919.02, CoreFX 4.6.26919.02), 64bit RyuJIT

// * Diagnostic Output - ConcurrencyVisualizerProfiler *
Exported 1 CV trace file(s). Example:
c:\Projects\mldotnet\test\Microsoft.ML.Benchmarks\BenchmarkDotNet.Artifacts\20181120-1225-23644\netcoreapp2.1\Microsoft\ML\Benchmarks\MultiClassClassificationTrain\CV_Multiclass_WikiDetox_WordEmbeddings_SDCAMC.CvTrace
DO remember that this Diagnoser just tries to mimic the CVCollectionCmd.exe and you need to have Visual Studio with Concurrency Visualizer plugin installed to visualize the data.
| Method | Mean | StdDev |
|---|---|---|
| CV_Multiclass_WikiDetox_WordEmbeddings_SDCAMC | 69.84 s | 2.608 s |
And the new trace file opened with Concurrency Visualizer:
The Story
Recently I have been working on improving the performance of ML.NET (you can read more about it in my previous blog post). I wanted to understand the performance characteristics over the time and I knew that ML.NET does most of the things in parallel. FlameGraph is an aggragated form, not over time and per CPU so I could not use it to visualize the data. Few years ago I have been to a presentation where Sasha Goldshtein was using Concurrency Visualizer to easily show which Thread was allocating managed memory and triggering Garbage Collection. I remebered that this is the right tool for visualizing concurrent .NET code.
So I just downloaded it from Visual Studio Market Place, read the docs and watched some Channel 9 videos about it. (Personal recommendation: don’t ask for permission to read the docs or watch some training videos. This is part of doing the job right, not an extra task which can be omitted)
I started using it, but I did not like the fact that I had to do it manually every time I wanted to run some benchmark:
With a quick web search I was able to find a command line tool that can do it for me: Concurrency Visualizer command-line utility aka CVCollectionCmd.exe
So I switched from VS GUI to this command line tool. But again, my process was not fully automated and I was loosing time doing all this manually.
And then I asked myself two quesitons: how does CVCollectionCmd.exe work? Can I create a BenchmarkDotNet diagnoser out of it?
Reverse Engineering
I am now working for Microsoft so I had two options:
- send an email to some discission group and asks who owns the tool and could explain me how it works.
- do some Reverse Engineering and find it out on my own
Since I don’t like sending emails (in general) and asking for help when I can find the answer in a short time on my own I decided to use the debugger to attach to CVCollectionCmd.exe and just step into some methods. See how it works and what it generates.
To my suprise, the code was very clean and very well structured so finding out how it works was really easy!
So how does CVCollectionCmd.exe work? It creates two ETW sessions (kernel and user), enables some ETW providers and simply collects the data. After the tracing is done, it creates simple XML file with some basic info for the Concurrency Visualizer: process id, used providers and paths to both trace files.
So what I did next, was implementing a new BenchmarkDotNet diagnoser that does exactly the same thing ;)
How it works
ConcurrencyVisualizerProfiler uses EtwProfiler, which can be customized to enable requested ETW providers and profile the code.
Before the process with benchmarked code is started, EtwProfiler starts User and Kernel ETW sessions. Every session writes data to it’s own file and captures different data. User session listens for the .NET Runtime events (TPL, ThreadPool, ParallelLinq etc) while the Kernel session gets CPU stacks, context switches, IO events and some more. After this, the process with benchmarked code is started. During the benchmark execution all the data is captured and written to a trace file. Moreover, BenchmarkDotNet Engine emits it’s own events to be able to differentiate jitting, warmup, pilot and actual workload when analyzing the trace file. When the benchmarking is over, both sessions are closed and the two trace files are merged into one.
After both sessions are merged into a single file ConcurrencyVisualizerProfiler emits an XML file with all the data relevant for Concurrency Visualizer (the Visual Studio plugin). The .CVTrace file name is reported by the diagnoser, you can find it in the BenchmarkDotNet output:
// * Diagnostic Output - ConcurrencyVisualizerProfiler *
Exported 1 CV trace file(s). Example:
Full_path_ommited_for_brevity.CvTrace
DO remember that this Diagnoser just tries to mimic the CVCollectionCmd.exe and you need to have Visual Studio with Concurrency Visualizer plugin installed to visualize the data.
The difference between the trace files produced by CVCollectionCmd.exe and my new Diagnoser is that the trace files produced by the diagnoser can be also opened with PerfView and Windows Performance Analyzer. It was just a matter of correct naming of the file ;)
Limitations
What we have today comes with following limitations:
- ConcurrencyVisualizerProfiler works only on Windows
- Requires to run as Admin (to create ETW Kernel Session)
- No
InProcessToolchainsupport - To get the best possible managed code symbols you should configure your project in following way:
<DebugType>pdbonly</DebugType>
<DebugSymbols>true</DebugSymbols>
How to use it?
You need to install latest BenchmarkDotNet.Diagnostics.Windows package. It can be enabled in few ways, some of them:
- Use the new attribute (apply it on a class that contains Benchmarks):
[ConcurrencyVisualizerProfiler]
public class TheClassThatContainsBenchmarks { /* benchmarks go here */ }
- Extend the
DefaultConfig.Instancewith new instance ofConcurrencyVisualizerProfiler:
class Program
{
    static void Main(string[] args)
        => BenchmarkSwitcher
            .FromAssembly(typeof(Program).Assembly)
            .Run(args,
                DefaultConfig.Instance
                    .With(new ConcurrencyVisualizerProfiler())); // HERE
}
- Passing
-p CVor--profiler CVcommand line argument toBenchmarkSwitcher
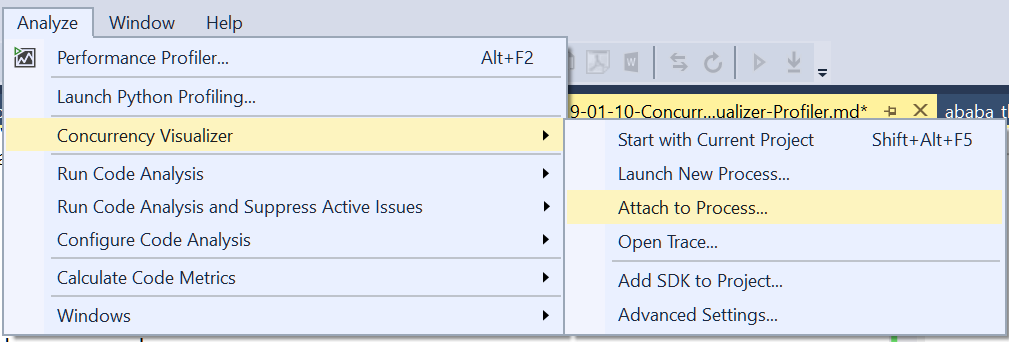
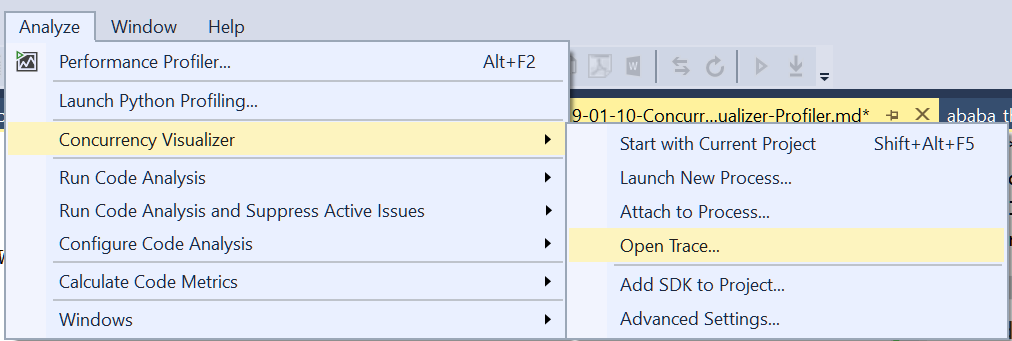
How to open the .CVTrace file in Visual Studio
After installing Concurrency Visualizer from Visual Studio Market Place you just need to go to: Analyze -> Concurrency Visualizer -> Open Trace
Sample usages
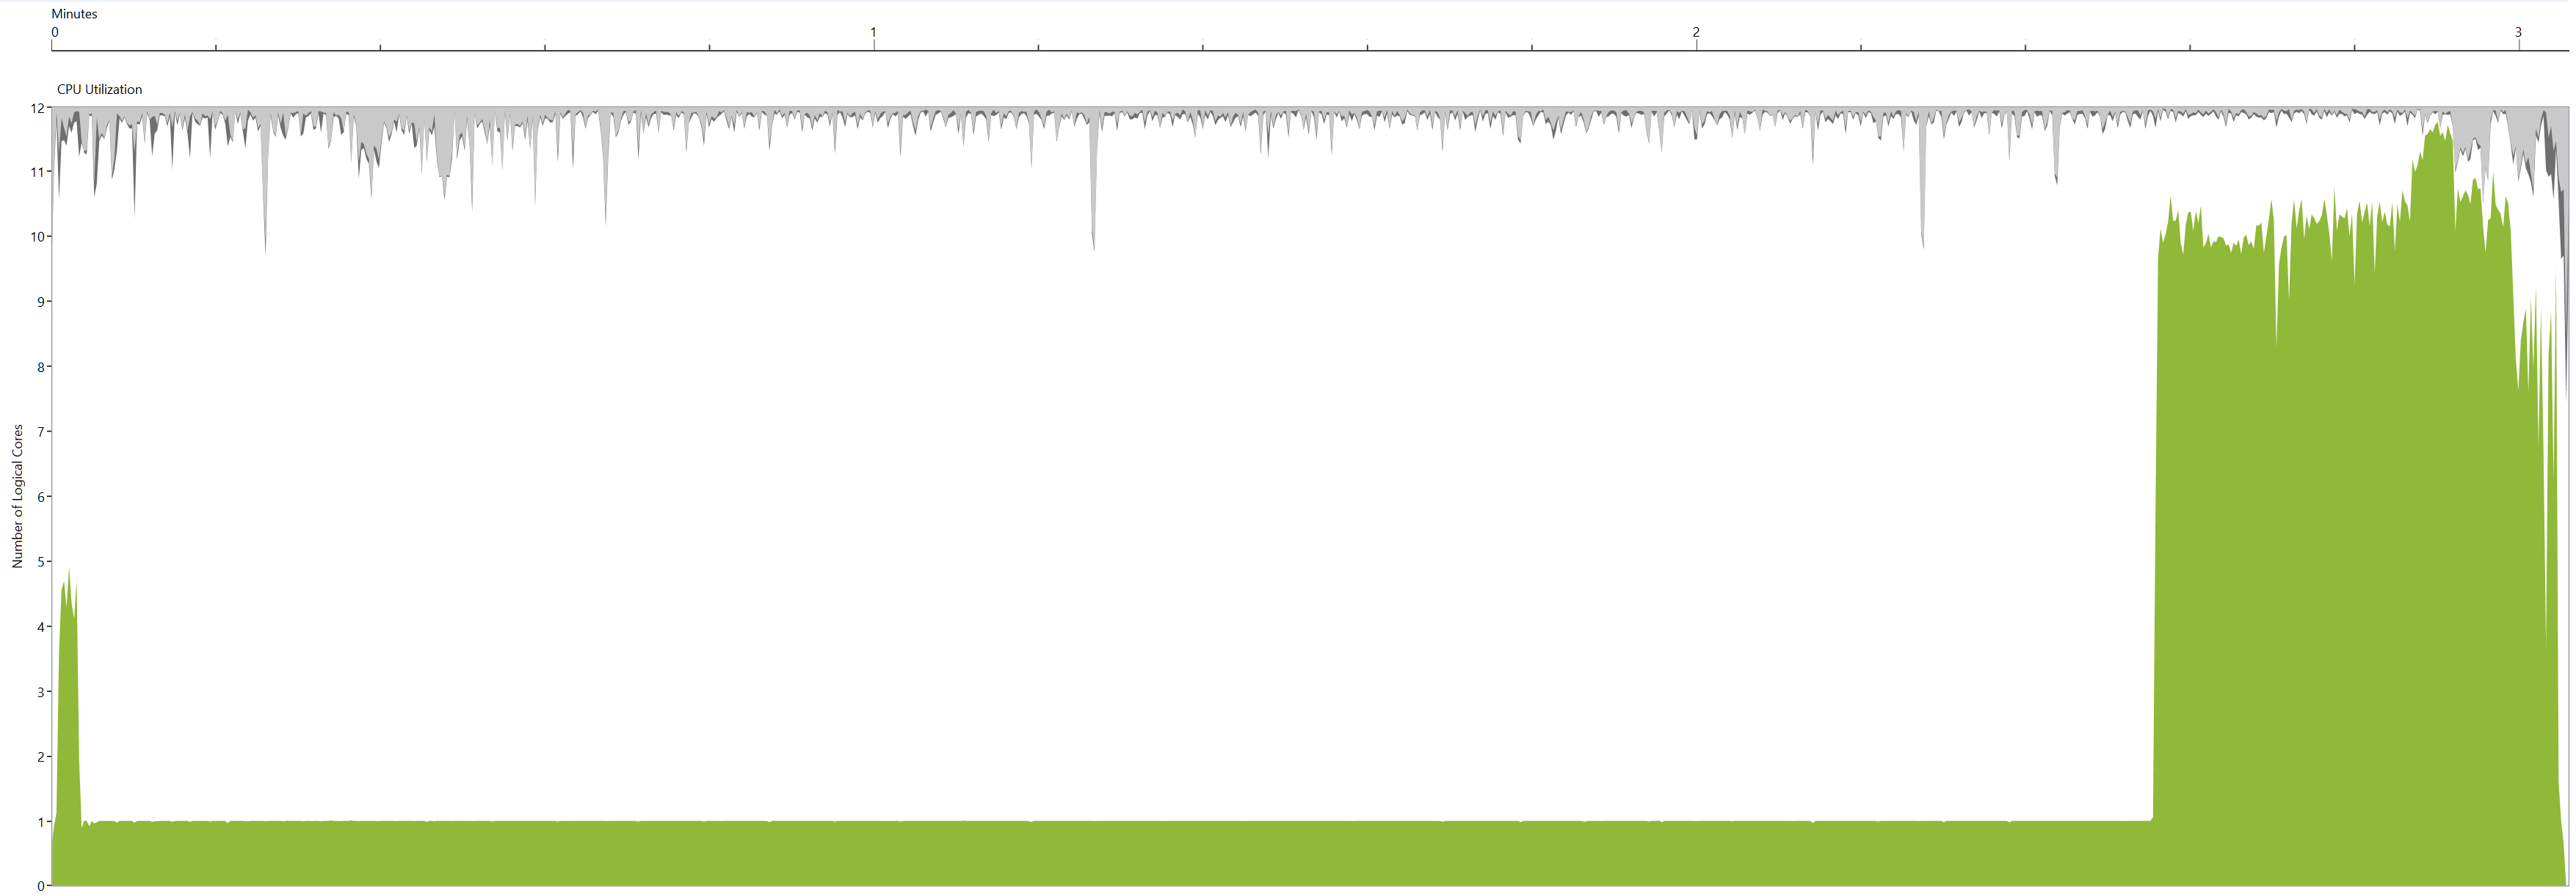
CPU Utilization
Using the new diagnoser to find out what is the CPU utilization for BinaryTrees_5 benchmark in the dotnet/performance repository.
dotnet run -c Release -f netcoreapp2.1 --filter *BinaryTrees_5* --profiler CV
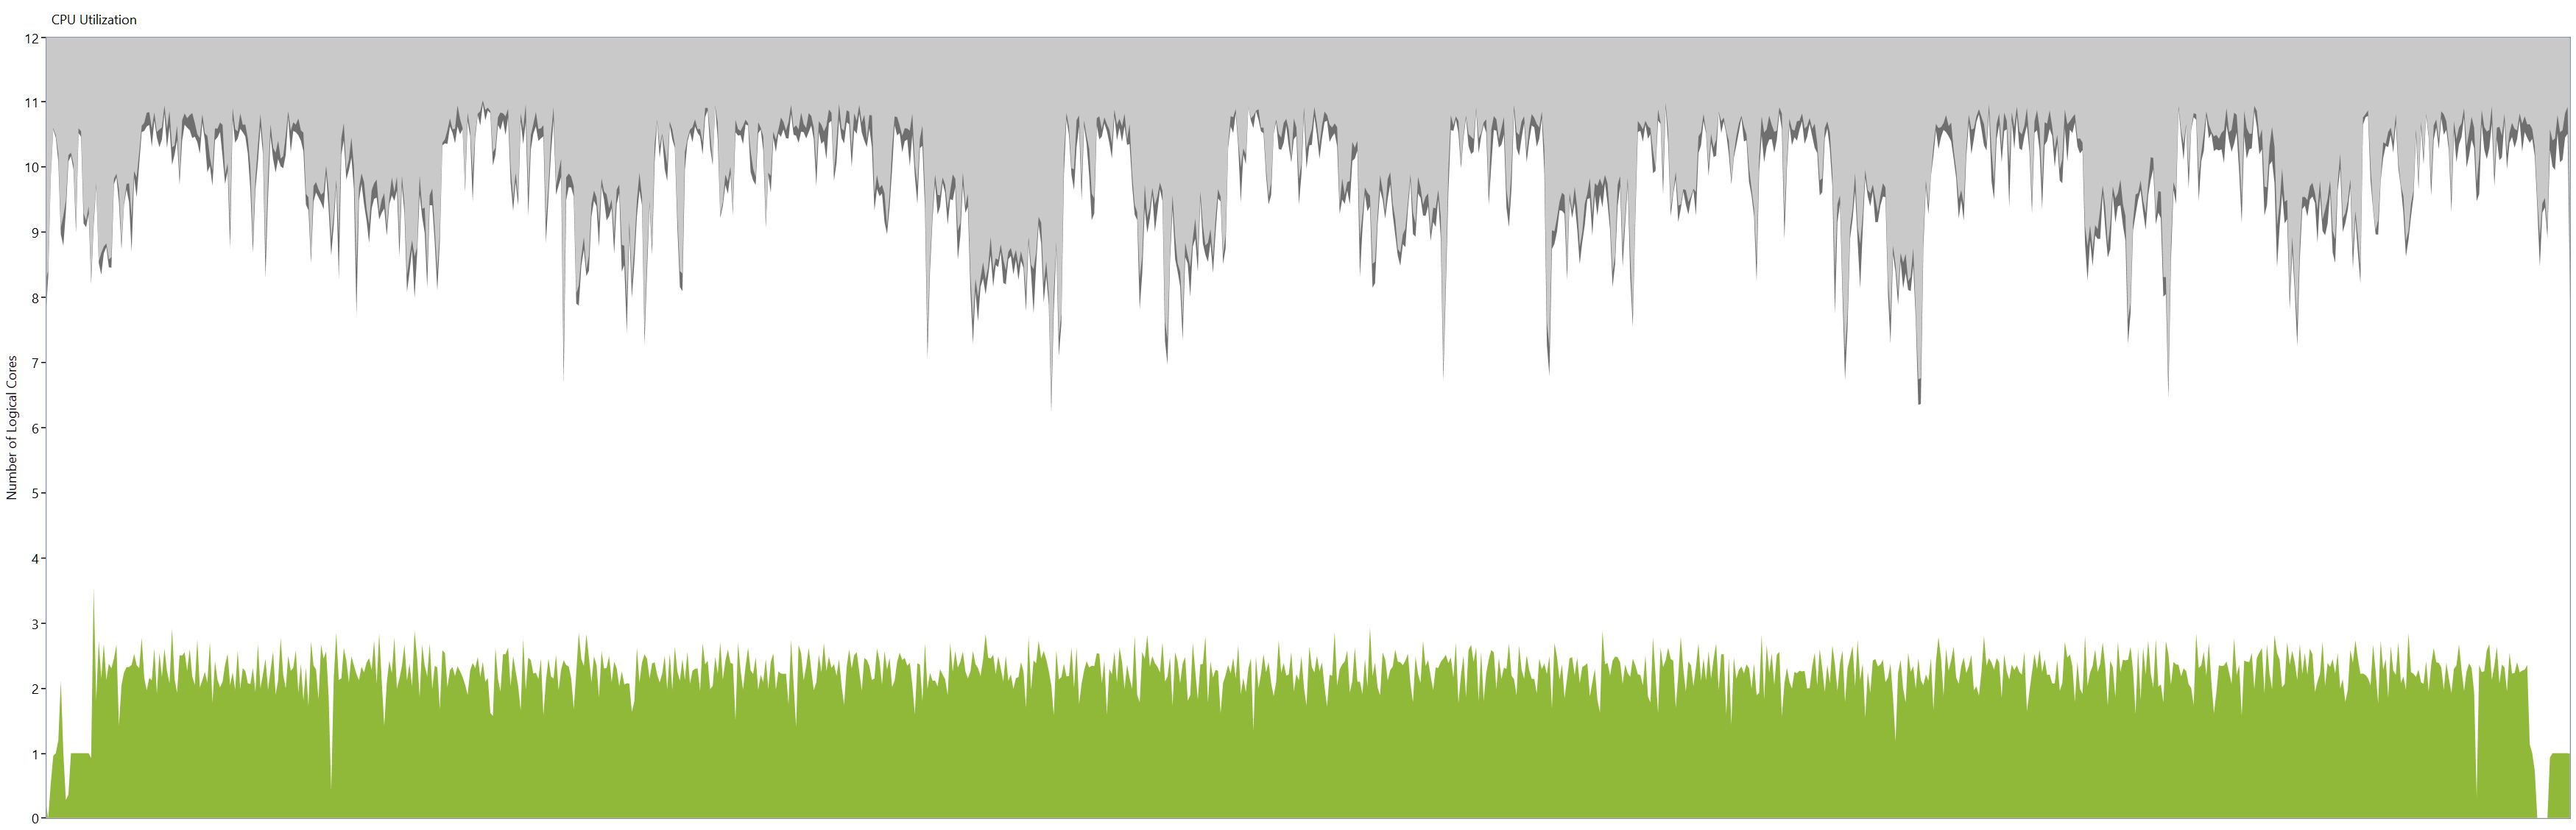
Note: As you can see, we are using 2 - 2.5 CPUs out of twelve!
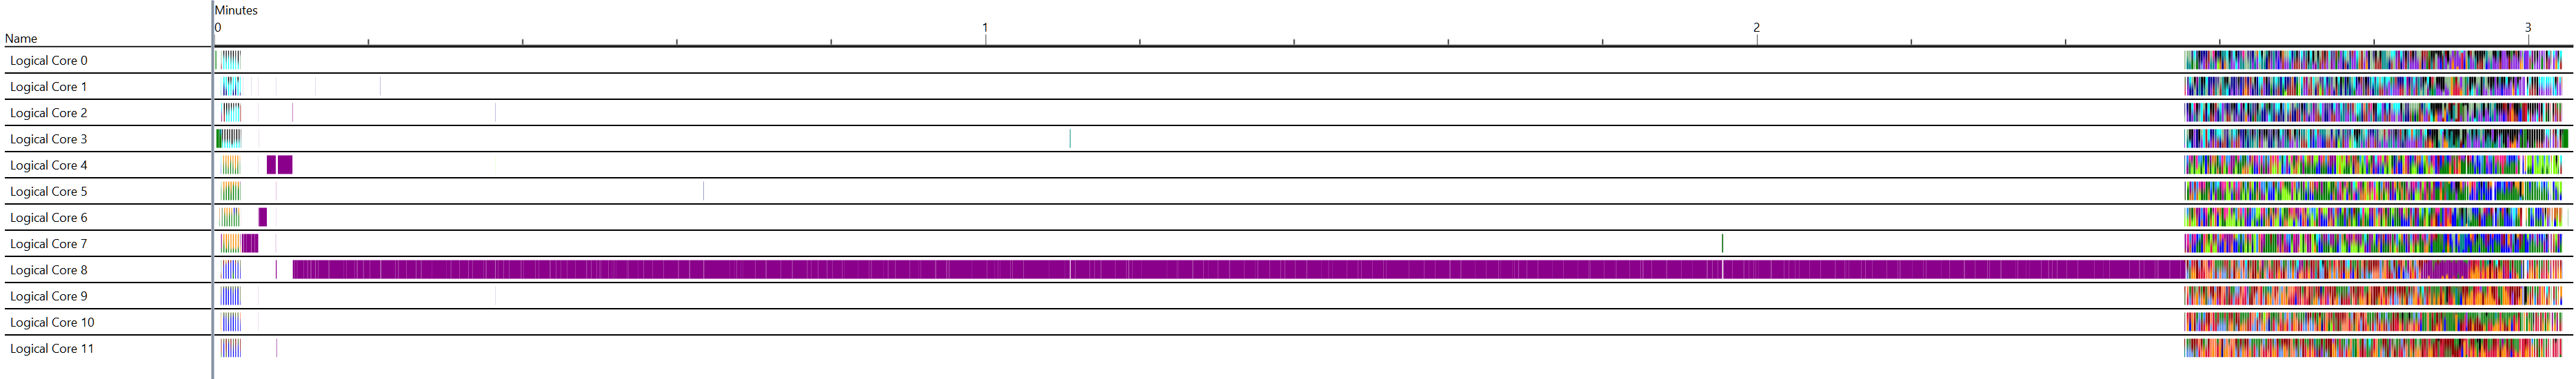
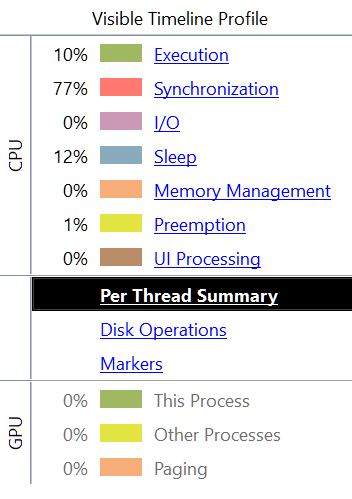
Synchronization
Using the new diagnoser to find out what % of time is spent for synchronization for SpectralNorm_3 benchmark in the dotnet/performance repository.
dotnet run -c Release -f netcoreapp2.1 --filter *spectralnorm_3* --profiler CV
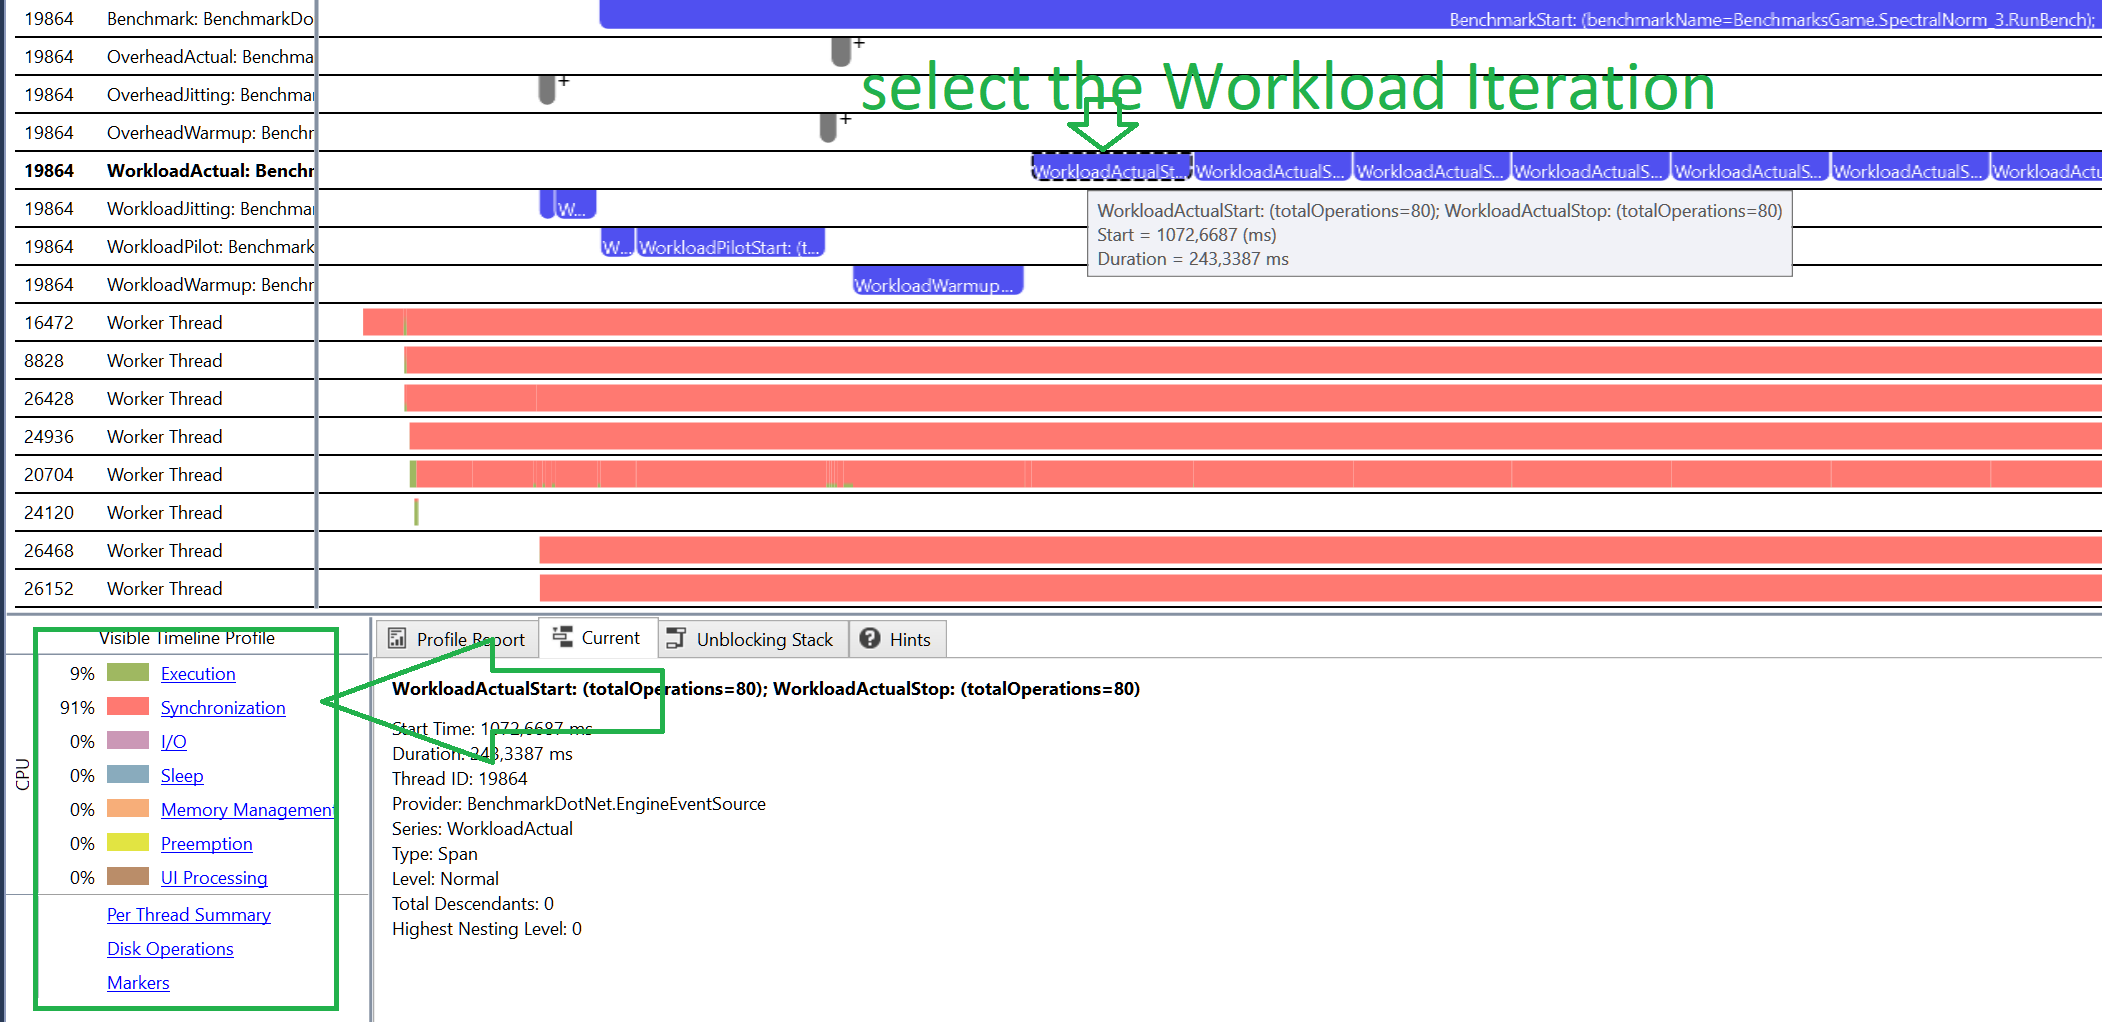
Note: 90% of the time is spent for synchronization.
Special Thanks
I wanted to thank Wojciech Nagórski who has fixed two bugs (#962, #958) that previously required all BenchmarkDotNet.Diagnostics.Windows users to use some weird workarounds to get it working. Thanks to Wojciech all you need to do is to install the package!
Summary
Concurrency Visualizer is very powerfull tool that can visualize concurrent code in user-friendly way. It’s a plugin for Visual Studio which can be downloaded for free from Visual Studio Market Place.
I really encourage you to read the docs and watch some Channel 9 videos and give it a try.
With the new BenchmarkDotNet feature you can get the trace file by running a single command from the console!