PerfCollectProfiler is a new BenchmarkDotNet diagnoser (plugin) that was released as part of 0.13.3. It can profile the benchmarked .NET code on Linux and export the data to a trace file which can be opened with PerfView, speedscope or any other tool that supports perf file format.
According to the official web page, speedscope.app is “a fast, interactive web-based viewer for performance profiles”. But I believe it’s more than that! In my opinion, it’s one of the best visualization tools for performance profiles ever!
Some time ago I have implemented SpeedScopeExporter which allows exporting any .NET Trace file to a speedscope json file format. It was released as part of 2.0.34TraceEvent library a few months ago, but so far it was not available for the end users from PerfView GUI/command line level.
Yesterday, a new version of PerfView got released with the new possibility to export to speed scope file format. So now the PerfView users can use speedscope.app to view their performance profiles and take advantage of all the goodness it offers!
ConcurrencyVisualizerProfiler is the new diagnoser for BenchmarkDotNet that I have implemented some time ago. It was released as part of 0.11.3. It allows to profile the benchmarked .NET code on Windows and exports the data to a trace file which can be opened with Concurrency Visualizer (plugin for Visual Studio, used to be a part of it).
Part of my job on the .NET Team is to improve the performance of existing .NET libraries. My current goal is to identify performance bottlenecks in ML.NET and recognize common performance issues that should be addressed by .NET framework.
In this blog post, I am describing how I approach sample performance problem using available free .NET tools and best practices for performance engineering.
EtwProfiler is the new diagnoser for BenchmarkDotNet that I have just finished. It was released as part of 0.11.2. It allows to profile the benchmarked .NET code on Windows and exports the data to a trace file which can be opened with PerfView or Windows Performance Analyzer.
Interviewing people is not an easy job to do. You want to find the person which is going to get things done, enjoy working with given project, fit into the team and be happy about the money you can offer.
As an interviewer, you are also being judged by the candidate. You very often create the first impression of the company. So you also need to make a good impression. Nobody wants to work with mean or incompetent people!
In this blog post, I am describing my way of conducting the interview. In my career, I have interviewed a hundred developers and hired over a dozen of them. So my experience is not very reach, it’s limited to “my sample”.
Disclaimer: After joining Microsoft I don’t interview candidates anymore. This post is my personal approach build upon the experience prior to joining MS.
I hope that my experience can help somebody to improve the interviewing process!
Disassembly Diagnoser is the new diagnoser for BenchmarkDotNet that I have just finished. It was released as part of 0.10.10. It allows to disassemble the benchmarked .NET code:
C# gives us great flexibility when it comes to using different kinds of memory. But the majority of the developers use only the managed one. Let’s take a brief look at what C# has to offer for us:
Stack memory - allocated on the Stack with the stackalloc keyword. Very fast allocation and deallocation. The size of the Stack is very small (usually < 1 MB) and fits well into CPU cache. But when you try to allocate more, you get StackOverflowException which can not be handled and immediately kills the entire process. Usage is also limited by the very short lifetime of the stack - when the method ends, the stack gets unwinded together with its memory. Stackalloc is commonly used for short operations that must not allocate any managed memory. An example is very fast logging of ETW events in corefx: it has to be as fast as possible and needs very little of memory (so the size limitation is not a problem).
Unmanaged memory - allocated on the unmanaged heap (invisible to GC) by calling Marshal.AllocHGlobal or Marshal.AllocCoTaskMem methods. This memory must be released by the developer with an explicit call to Marshal.FreeHGlobal or Marshal.FreeCoTaskMem. By using it we don’t add any extra pressure for the GC. It’s most commonly used to avoid GC in scenarios where you would normally allocate huge arrays of value types without pointers. Here you can see some real-life use cases from Kestrel.
Managed memory - We can allocate it with the new operator. It’s called managed because it’s managed by the Garbage Collector (GC). GC decides when to free the memory, the developer doesn’t need to worry about it. As described in one of my previous blog posts, the GC divides managed objects into two categories:
Small objects (size < 85 000 bytes) - allocated in the generational part of the managed heap. The allocation of small objects is fast. When they are promoted to older generations, their memory is usually being copied. The deallocation is non-deterministic and blocking. Short-lived objects are cleaned up in the very fast Gen 0 (or Gen 1) collection. The long living ones are subject of the Gen 2 collection, which usually is very time-consuming.
Large objects (size >= 85 000 bytes) - allocated in the Large Object Heap (LOH). Managed with the free list algorithm, which offers slower allocation and can lead to memory fragmentation. The advantage is that large objects are by default never copied. This behavior can be changed on demand. LOH has very expensive deallocation (Full GC) which can be minimized by using ArrayPool.
tl;dr Pass and return by reference to avoid large struct copying. It’s type and memory safe. It can be even faster than unsafe!
Introduction
Since C# 1.0 we could pass arguments to methods by reference. It means that instead of copying value types every time we pass them to a method we can just pass them by reference. It allows us to overcome one of the very few disadvantages of value types which I described in my previous blog post “Value Types vs Reference Types”.
Passing is not enough to cover all scenarios. C# 7.0 adds new possibilities: declaring references to local variables and returning by reference from methods.
Note: I want to focus on the performance aspect here. If you want to learn more about ref returns and ref locals you should read these awesome blog posts from Vladimir Sadov. He is the software engineer who has implemented this feature for C# compiler. So you can get it straight from the horse’s mouth!
Reminder
Let’s analyse some simple C# examples to make sure that we have good common understanding of the syntax.
void method(ref int argument) - The argument is passed to the method by reference.
tl;dr structs have better data locality. Value types add much less pressure for the GC than reference types. But big value types are expensive to copy and you can accidentally box them which is bad.
Introduction
The .NET framework implements Reference Types and Value Types. C# allows us to define custom value types by using struct and enum keywords. class, delegate and interface are for reference types. Primitive types, like byte, char, short, int and long are value types, but developers can’t define custom primitive types. In Java primitive types are also value types, but Java does not expose a possibility to define custom value types for developers ;)
Value Types and Reference Types are very different in terms of performance characteristics. In my next blog posts, I am going to describe ref returns and locals, ValueTask<T> and Span<T>. But I need to clarify this matter first, so the readers can understand the benefits.
Note: To keep my comparison simple I am going to use ValueTuple<int, int> and Tuple<int, int> as the examples.
Memory Layout
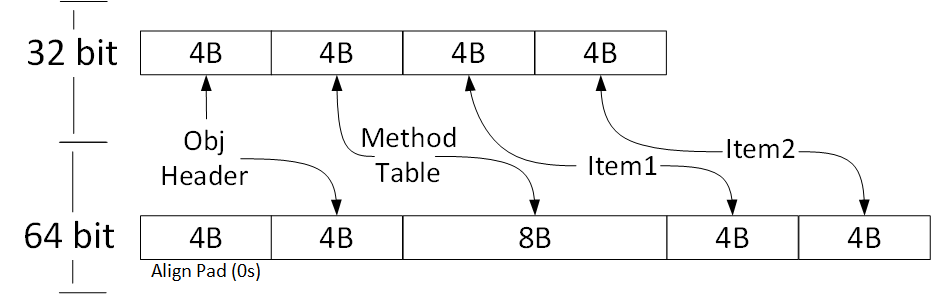
Every instance of a reference type has extra two fields that are used internally by CLR.
ObjectHeader is a bitmask, which is used by CLR to store some additional information. For example: if you take a lock on a given object instance, this information is stored in ObjectHeader.
MethodTable is a pointer to the Method Table, which is a set of metadata about given type. If you call a virtual method, then CLR jumps to the Method Table and obtains the address of the actual implementation and performs the actual call.
Both hidden fields size is equal to the size of a pointer. So for 32 bit architecture, we have 8 bytes overhead and for 64 bit 16 bytes.
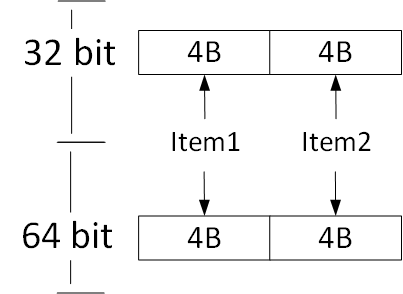
Value Types don’t have any additional overhead members. What you see is what you get. This is why they are more limited in terms of features. You cannot derive from struct, lock it or write finalizer for it.
tl;dr Use ArrayPool<T> for large arrays to avoid Full GC.
Introduction
.NET’s Garbage Collector (GC) implements many performance optimizations. One of them, the generational model assumes that young objects die quickly, whereas old live longer. This is why managed heap is divided into three Generations. We call them Gen 0 (youngest), Gen 1 (short living) and Gen 2 (oldest). New objects are allocated in Gen 0. When GC tries to allocate a new object and Gen 0 is full, it performs the Gen 0 cleanup. So it performs a partial cleanup (Gen 0 only)! It is traversing the object’s graph, starting from the roots (local variables, static fields & more) and marks all of the referenced objects as living objects.
This is the first phase, called “mark”. This phase can be nonblocking, everything else that GC does is fully blocking. GC suspends all of the application threads to perform next steps!
Living objects are being promoted (most of the time moved == copied!) to Gen 1, and the memory of Gen 0 is being cleaned up. Gen 0 is usually very small, so this is very fast. In a perfect scenario, which could be a web request, none of the objects survive. All allocated objects should die when the request ends. So GC just sets the next object pointer to the beginning of Gen 0.
After some Gen 0 collections, we get to the situation, when Gen 1 is also full, so GC can’t just promote more objects to it. Then it simply collects Gen 1 memory. Gen 1 is also small, so it’s fast. Anyway, the Gen 1 survivors are being promoted to Gen 2. Gen 2 objects are supposed to be long living objects. Gen 2 is very big and it’s very time-consuming to collect its memory. So garbage collection of Gen 2 is something that we want to avoid. Why? let’s take a look at the following video to find out how the Gen 2 collection can affect user experience:
Large Object Heap (LOH)
When GC is promoting objects to next generation it’s copying the memory. As you can imagine, it would be very time-consuming for large objects like big arrays or strings. This is why GC has another optimization. Any object that is bigger than 85 000 bytes is considered to be large. Large objects are stored in a separate part of the managed heap, called Large Object Heap (LOH). This part is managed with free list algorithm. It means that GC has a list of free segments of memory, and when we want to allocate something big, it’s searching through the list to find a feasible segment of memory for it. So large objects are by default never moved in memory.
However, if you run into LOH fragmentation issues you need to compact LOH. Since .NET 4.5.1 you can do this on demand.
The Problem
When a large object is allocated, it’s marked as Gen 2 object. Not Gen 0 as for small objects. The consequences are that if you run out of memory in LOH, GC cleans up whole managed heap, not only LOH. So it cleans up Gen 0, Gen 1 and Gen 2 including LOH. This is called full garbage collection and is the most time-consuming garbage collection. For many applications, it can be acceptable. But definitely not for high-performance web servers, where few big memory buffers are needed to handle an average web request (read from a socket, decompress, decode JSON & more).
Using the ETW to collect the PMC counters is easy when you know how. It took me some time to get it working so I am gonna describe it in case somebody wants to do it without BenchmarkDotNet. The types used below come from the Microsoft.Diagnostics.Tracing.TraceEventNuGet package.
BenchmarkDotNet is a powerful .NET library for benchmarking (more about it). This post describes how you can collect Hardware Performance Counters with BenchmarkDotNet. If you want to learn about the ETW internals behind it then you might find this post useful.
The Story
Some time ago I have noticed that software engineers who are working on the Span<T> are struggling with some benchmarking issues. With problems like unstable results, which BenchmarkDotNet solves. So I asked why don’t they use BenchmarkDotNet?
Yeah, we have. In general I love BenchmarkDotNet and use it in many cases. It does have better front end reporting capabilities and is more mature from reliability and statistical analysis perspective. But it seems like BenchmarkDotNet does not support measuring instructions retired, cache misses, and branch mispredictions that we often find very useful. Would be great to combine the efforts/features :-)
It’s been ten days since Visual Studio 2017 RTM was released. .xproj and project.json files are not going to be supported anymore so it’s time to port our (ASP).NET Core projects to the new, simplified .csproj project file format.
This post is not a complete guide on porting. I want to show you what problems I have faced and how I had solved them. I hope that somebody will find this useful. The examples are based on an ASP.NET Core application for trading energy that I develop at work. So it’s something real, not “Hello World”. I have also ported BenchmarkDotNet to the new .csproj file format so it’s a mixture of my personal experience.
BenchmarkDotNet is a powerful .NET library for benchmarking (more about it). MemoryDiagnoser is one of its features that allows measuring the number of allocated bytes and garbage collection frequency.
The Story
Before the 0.10.1 version of BenchmarkDotNet the MemoryDiagnoser was part of BenchmarkDotNet.Diagnostics.Windows package. Internally it was using Event Tracing for Windows (ETW), which had following implications:
It was not cross-platform (Windows only).
It was as accurate as ETW allowed us it to be. We were using the GCAllocationTick event which is raised “Each time approximately 100 KB is allocated”. Which means that if 199 KB was allocated we would know only about the first 100 KB.