
The new MemoryDiagnoser is now better than ever!
Introduction
BenchmarkDotNet is a powerful .NET library for benchmarking (more about it). MemoryDiagnoser is one of its features that allows measuring the number of allocated bytes and garbage collection frequency.
The Story
Before the 0.10.1 version of BenchmarkDotNet the MemoryDiagnoser was part of BenchmarkDotNet.Diagnostics.Windows package. Internally it was using Event Tracing for Windows (ETW), which had following implications:
- It was not cross-platform (Windows only).
- It was as accurate as ETW allowed us it to be. We were using the GCAllocationTick event which is raised “Each time approximately 100 KB is allocated”. Which means that if
199 KBwas allocated we would know only about the first100 KB.
But our users noticed also other problems:
- We were not excluding the allocations from
[Setup]and[Cleanup]methods #186 - We had issues with scaling of the results #133
You need to know that at BenchmarkDotNet we are obsessed about accuracy and correctness of the results. People trust us, and we can’t fail them. I really wanted to fix these problems. But at this moment I had no good idea how to fix these issues.
I am following @dotnetissues on twitter who tweets about every new issue opened in #dotnet repositories. That’s how I found out that Ayende asked the CLR team to Expose GC allocation statistics. It soon got exposed via the GC.GetAllocatedBytesForCurrentThread(). By reading this thread I have also found out about the existence of AppDomain.MonitoringTotalAllocatedMemorySize (thanks to Omariom).
So at this point of time, I knew how to get an accurate number of allocated bytes both for the classic .NET Framework and .NET Core. I was ready to start coding ;) The rest was easy:
- Change the diagnoser flow to allow the diagnosers to attach or detach whenever they want (at the beginning, after setup or before cleanup) #277
- Eliminate ALL heap allocations in the Engine (code that executes the benchmarks). This was fun! Also part of #277
- Make the new
MemoryDiagnoserbuilt-in to gather the allocation statistics from within the process itself. #284 - Solve the scaling problem. Also part of #284
- Make sure that everything works fine for .NET Framework, .NET Core and Mono. Also part of #284
Can it be trusted now?
Let’s create a new console app, install latest BenchmarkDotNet, run following code and analyse the results.
class Program
{
    static void Main(string[] args)
    {
        BenchmarkRunner.Run<Benchmarks>();
    }
}

[MemoryDiagnoser] // we need to enable it in explicit way
[RyuJitX64Job, LegacyJitX86Job] // let's run the benchmarks for 32 & 64 bit
public class Benchmarks
{
    [Benchmark]
    public byte[] EmptyArray() => Array.Empty<byte>();

    [Benchmark]
    public byte[] EightBytes() => new byte[8];

    [Benchmark]
    public byte[] SomeLinq()
    {
        return Enumerable
            .Range(0, 100)
            .Where(i => i % 2 == 0)
            .Select(i => (byte)i)
            .ToArray();
    }
}
The results (some columns were removed for brevity):
| Method | Platform | Mean | StdDev | Gen 0 | Allocated |
|---|---|---|---|---|---|
| EmptyArray | X86 | 4.4947 ns | 0.0530 ns | - | 0 B |
| EightBytes | X86 | 3.1586 ns | 0.0215 ns | 0.0060 | 20 B |
| SomeLinq | X86 | 1,600.6928 ns | 7.4951 ns | 0.0132 | 356 B |
| EmptyArray | X64 | 5.9602 ns | 0.0411 ns | - | 0 B |
| EightBytes | X64 | 4.6416 ns | 0.0956 ns | 0.0097 | 32 B |
| SomeLinq | X64 | 1,620.6928 ns | 12.6973 ns | 0.0631 | 496 B |
Let’s analyse the results:
- Allocated for
EmptyArrayis zero. That’s great, the simplest case is covered. - Allocated for
EightBytesis20 BforX86and32 BforX64. Why is that? We need extra space for object header, method table pointer and length of the array. The overhead is 3x Pointer Size.8 + 3x4 = 20. 8 + 3x8 = 32 - Allocated for
SomeLinqis356 BforX86and496 BforX64. Let’s use the Visual Studio 2015 Memory Allocation Profiler to compare the results.
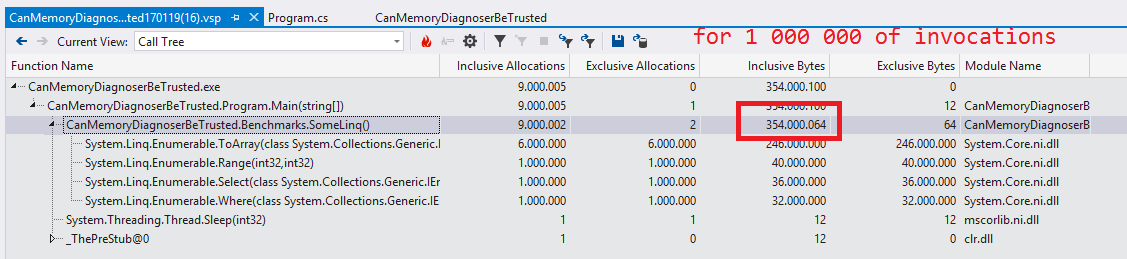
Visual Studio Memory Allocation Profiler shows 354 000 064 for 1 000 000 of invocations, which gives us 354 bytes per invocation. The difference is 2 bytes which are 0,5649718% of the total. Not bad, but still not perfect. Let’s say that the new MemoryDiagnoser is 99.5% accurate. Matt Warren says that most probably the Allocation quantum is the reason for that.
How to use it?
Now it’s part of our core package, so you don’t need to install any extra dependencies. It’s not enabled by default. You can turn it on in three ways:
- Use the new attribute (apply it on a class that contains Benchmarks):
[MemoryDiagnoser]
public class TheClassThatContainsBenchmarks { /* benchmarks go here */ }
- Tell your custom config to use it:
private class CustomConfig : ManualConfig
{
    public CustomConfig()
    {
        Add(MemoryDiagnoser.Default);
    }
}
- Passing
-mor--memorycommand line argument toBenchmarkSwitcher
How to read the results
| Method | Gen 0 | Allocated |
|---|---|---|
| A | - | 0 B |
| B | 1 | 496 B |
- Allocated contains the size of allocated managed memory. Stackalloc/native heap allocations are not included. It’s per single invocation, inclusive.
- The
Gen Xcolumn contains the number ofGen Xcollections per 1 000 Operations. If the value is equal 1, then it means that GC collects memory once per one thousand of benchmark invocations in generationX. BenchmarkDotNet is using some heuristic when running benchmarks, so the number of invocations can be different for different runs. Scaling makes the results comparable. -in the Gen column means that no garbage collection was performed.-in the Allocated column means that no managed memory was allocated. Depending on the version of BenchmarkDotNet you are using, it might be represented with-or0 B.- If
Gen Xcolumn is not present, then it means that no garbage collection was performed for generationX. If none of your benchmarks induces the GC, the Gen columns are not present.
When reading the results please keep in mind that:
- 1 kB = 1 024 bytes. Not 1000.
- Every reference type instance has two extra fields: object header and method table pointer. That’s why the results always include 2x pointer size for every object allocation. For more detailed info about extra overhead please read this great blog post How does Object.GetType() really work? by Konrad Kokosa.
- CLR does some aligning. If you try to allocate
new byte[7]array, it will allocatebyte[8]array.
FAQ
- Can the
Gen 0/1/2results be compared with old results produced by older versions of BenchmarkDotNet? No, they can’t. We scale the results in a different way. - Why is the Allocated column missing on Mono? Because Mono does not provide any API to read the number of allocated bytes.
- Can the MemoryDiagnoser affect the time results by introducing some extra overhead? No, because we perform separate run for the diagnosers only. The results from this run are not included in the timing results.
- Is there any API in BenchmarkDotNet that exposes the GC Statistics? Yes, the
summaryreturned byBenchmarkRunner.Runcontains allreports, which expose theGcStatsproperty. - How to verify that particular code does not perform any heap allocations?
var summary = BenchmarkRunner.Run<BenchmarksThatMustNotAllocate>();

Assert.True(summary.Reports.All(report => report.GcStats.BytesAllocatedPerOperation == 0));
Sources
- Garbage Collection ETW Events by MSDN
- How does Object.GetType() really work? by Konrad Kokosa
- Design of Allocator by CLR Team
- GitHub issues: