
Profiling .NET on Linux with BenchmarkDotNet
PerfCollectProfiler
PerfCollectProfiler is a new BenchmarkDotNet diagnoser (plugin) that was released as part of 0.13.3. It can profile the benchmarked .NET code on Linux and export the data to a trace file which can be opened with PerfView, speedscope or any other tool that supports perf file format.
Demo
Following code is one of the official BenchmarkDotNet samples
using System.IO;
using BenchmarkDotNet.Attributes;

namespace BenchmarkDotNet.Samples
{
    [PerfCollectProfiler(performExtraBenchmarksRun: false)]
    public class IntroPerfCollectProfiler
    {
        private readonly string path = Path.Combine(Path.GetTempPath(), Path.GetRandomFileName());
        private readonly string content = new string('a', 100_000);

        [Benchmark]
        public void WriteAllText() => File.WriteAllText(path, content);

        [GlobalCleanup]
        public void Delete() => File.Delete(path);
    }
}
The command:
sudo dotnet run -c Release -f net7.0 --filter '*PerfCollectProfiler*' --profiler perf --job short
The regular output:
BenchmarkDotNet=v0.13.3.20230113-develop, OS=ubuntu 18.04
Intel Xeon CPU E5-1650 v4 3.60GHz, 1 CPU, 12 logical and 6 physical cores
.NET SDK=7.0.101
  [Host] : .NET 7.0.1 (7.0.122.56804), X64 RyuJIT AVX2
  Dry    : .NET 7.0.1 (7.0.122.56804), X64 RyuJIT AVX2

Job=ShortRun  IterationCount=3  LaunchCount=1
WarmupCount=3


// * Diagnostic Output - PerfCollectProfiler *
Exported 1 trace file(s). Example:
/home/adam/projects/BenchmarkDotNet/samples/BenchmarkDotNet.Samples/BenchmarkDotNet.Artifacts/BenchmarkDotNet.Samples.IntroPerfCollectProfiler.WriteAllText-20230113-180354.trace.zip
| Method | Mean | Error | StdDev |
|---|---|---|---|
| WriteAllText | 96.83 us | 51.98 us | 2.849 us |
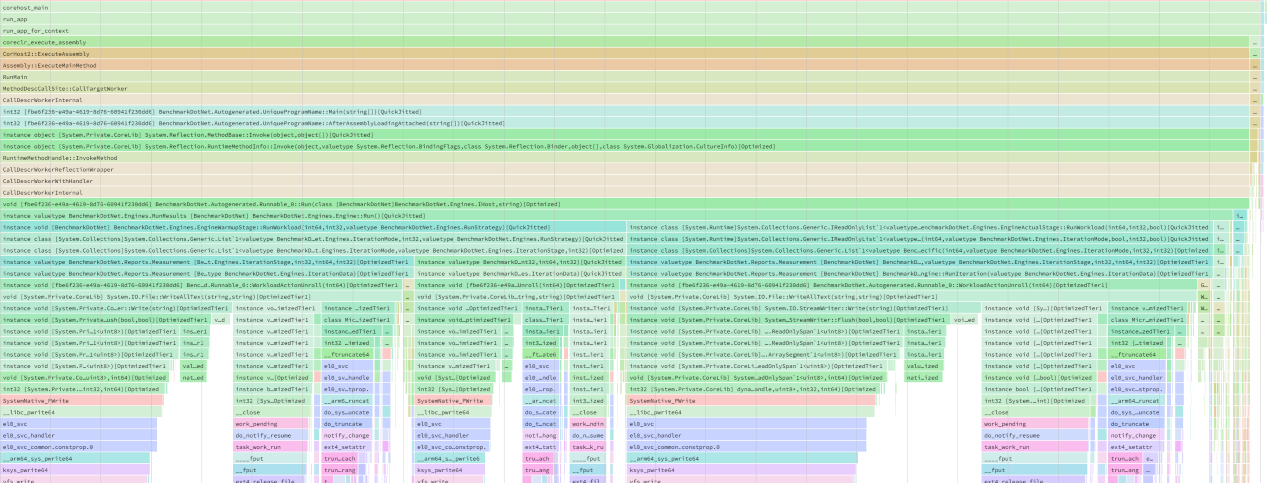
And the new trace file opened with speedscope:
The Story
In the middle of 2019 I was working on improving the performance of string methods on Linux (#24889, #24973). When I was done with the issues reported by the customers, it became clear to me that I need to get a better understanding of all Windows vs Unix .NET performance gaps. My goal was to fix the most important issues before the customers hit them. Thanks to previous investments in the performance culture of the .NET Team it was an easy job, as all I had to do was running all dotnet/performance micro-benchmarks on the same hardware for Windows and Unix and compare the results using ResultsComparer tool. To make it an apples-to-apples comparison I configured my work PC to dual-boot Windows 10 and Ubuntu 18.04. I wanted to include macOS too, as many .NET users develop software on macOS. So I’ve used Boot Camp and installed Windows on my MacBook Pro. The comparison has identified multiple gaps: #13628, #31268, #31269, #31270, #31271, #31273, #31275, #13669, #13675, #13676, #13684 and #31396.
Since there was plenty of them, I decided to automate the profiling. I’ve created a new BenchmarkDotNet branch and started working on a wrapper for perfcollect. perfcollect is a very powerful bash script that automates data collection. It’s internally using perf and LTTng. All the credit for perfcollect goes to Brian Robbins, who authored this tool. perfcollect does all the heavy lifting, my BenchmarkDotNet plugin is built upon on the work of Brian.
I was not able to get it working quickly and I got stuck, so I pushed my changes and just switched to VTune. For this particular investigation, I’ve stopped using perfcollect as I did not like the fact that I had to copy the produced trace file to Windows to open it with PerfView. VTune provided me the answers I needed and I’ve moved one to some other work.
I got back to working on it in 2020, but again with no success. In September 2022 together with Jan Vorlicek we have started working on adding arm64 support to the Disassembly Diagnoser (another topic for a blog post). We did that as a part of a one week long internal Microsoft Open Source hackathon. We made some great progress quicker than expected and still had some time left, so I’ve asked Jan for help with the perfcollect plugin (BTW Jan is one of the smartest people I’ve ever got to work with, at the same time being very humble and always eager to help). Jan has identified the source of my problems, I’ve changed the way of stopping the perfcollect process and got it working. The rest is history.
How it works
PerfCollectProfiler uses perfcollect bash script for profiling and dotnet symbol for downloading symbols for the native libraries.
Before the process with benchmarked code is started, the plugin searches for perfcollect file stored in artifacts folder. If it’s not present it means that the tool has not been installed yet. In such case, it loads the script file from library resources (the script is embeded in the .dll to ensure we are using a version that we tested), stores it one the disk, makes it an executable and invokes the install command (with -force option to avoid the need of user input for confirmation).
The next thing it does is identifying .NET SDK folder path and searching for missing native symbol files (.so.dbg). When some symbols are missing, it installs dotnet symbol tool in a dedicated folder (to always use latest version and avoid issues with broken existing configs) and commands it to recursively download symbols for all native libraries present in the SDK folder.
Sample log output:
// start dotnet tool install dotnet-symbol --tool-path "/tmp/BenchmarkDotNet/symbols" in
You can invoke the tool using the following command: dotnet-symbol
Tool 'dotnet-symbol' (version '1.0.406001') was successfully installed.
// command took 2.36s and exited with 0
// start /tmp/BenchmarkDotNet/symbols/dotnet-symbol --recurse-subdirectories --symbols "/usr/share/dotnet/dotnet" "/usr/share/dotnet/lib*.so" in
Downloading from https://msdl.microsoft.com/download/symbols/
/usr/share/dotnet/dotnet.dbg already exists, file not written
Writing: /usr/share/dotnet/shared/Microsoft.NETCore.App/7.0.1/libSystem.Globalization.Native.so.dbg
Writing: /usr/share/dotnet/shared/Microsoft.NETCore.App/7.0.1/libcoreclrtraceptprovider.so.dbg
Writing: /usr/share/dotnet/shared/Microsoft.NETCore.App/7.0.1/libSystem.Security.Cryptography.Native.OpenSsl.so.dbg
Writing: /usr/share/dotnet/shared/Microsoft.NETCore.App/7.0.1/libmscordaccore.so.dbg
Writing: /usr/share/dotnet/shared/Microsoft.NETCore.App/7.0.1/libSystem.IO.Compression.Native.so.dbg
Writing: /usr/share/dotnet/shared/Microsoft.NETCore.App/7.0.1/libSystem.Net.Security.Native.so.dbg
Writing: /usr/share/dotnet/shared/Microsoft.NETCore.App/7.0.1/libcoreclr.so.dbg
Writing: /usr/share/dotnet/shared/Microsoft.NETCore.App/7.0.1/libSystem.Native.so.dbg
Writing: /usr/share/dotnet/shared/Microsoft.NETCore.App/7.0.1/libclrjit.so.dbg
Writing: /usr/share/dotnet/shared/Microsoft.NETCore.App/7.0.1/libmscordbi.so.dbg
Writing: /usr/share/dotnet/shared/Microsoft.NETCore.App/7.0.1/libhostpolicy.so.dbg
Writing: /usr/share/dotnet/shared/Microsoft.NETCore.App/7.0.1/libclrgc.so.dbg
Once everything is in place, the diagnoser starts perfcollect process. perfcollect does all the heavy lifting (the creation of lttng sessions, perf tool usage etc). When BenchmarkDotNet starts the benchmarking process, it sets all the necessary environment variables. By doing that, it ensures that all symbols will get solved and the trace file will be complete.
When benchmarking process quits, the plugin stops the perfcollect process by killing it with SIGINT signal. perfcollect works for a moment, exports the trace file and quits.
Limitations
PerfCollectProfiler has following limitations:
- It supports only Linux. For Windows you can use EtwProfiler, for other Unixes like macOS the EventPipeProfiler. EventPipeProfiler supports every OS, but it has no information about native methods.
- Requires to run as root. It’s a PITA as all the files BDN creates directly and indirectly will be created by the root.
- No
InProcessToolchainsupport (and no plans to add it). - Currently the trace file contains no events, but we are working on it.
How to use it?
You need to install BenchmarkDotNet 0.13.3 or newer.
It can be enabled via command line arguments (as long as you pass args to BenchmarkSwitcher or BenchmarkRunner). You won’t need to recompile your code to use it:
--profiler perf
Or you can extend the DefaultConfig.Instance with new instance of PerfCollectProfiler and the profiler will work for all benchmarks:
class Program
{
    static void Main(string[] args)
        => BenchmarkSwitcher
            .FromAssembly(typeof(Program).Assembly)
            .Run(args,
                DefaultConfig.Instance
                    .With(PerfCollectProfiler.Default)); // HERE
}
Or you can apply the attribute, but it will work only for benchmarks from given class:
[PerfCollectProfiler]
public class TheClassThatContainsBenchmarks { /* benchmarks go here */ }
Configuration
To configure the new diagnoser you need to create an instance of PerfCollectProfilerConfig class and pass it to the PerfCollectProfiler constructor. The parameters that config ctor accepts are:
performExtraBenchmarksRun: when set to true, benchmarks will be executed one more time with the profiler attached. If set to false, there will be no extra run but the results will contain overhead. False by default, as I expect the overhead to be less than 3%.timeoutInSeconds: how long BenchmarkDotNet should wait for the perfcollect script to finish processing the trace. 300s by default.
The default config should be fine for 99% of users ;)
Analyzing the trace files
There are multiple ways to work with the trace files produced by perfcollect:
- You can copy them to Windows and open with PerfView.
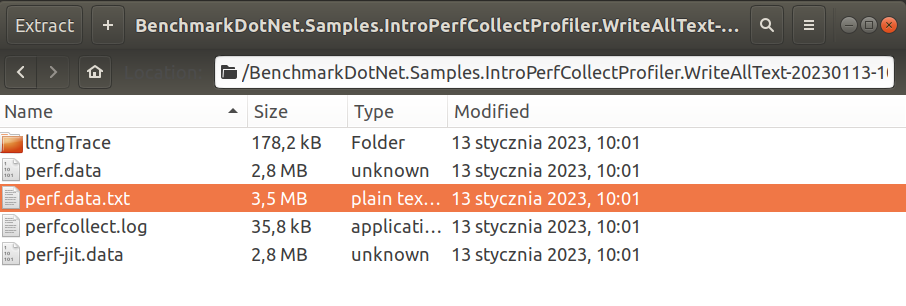
- You can unzip the trace file, take the file produced by perf utility and open it with any tool that supports perf file format.
If you are not familiar with speedscope you can read my old blog post about it. The tool is so intuitive that you don’t really need to prepare yourself for using it.
- Unzip the trace file, go to https://www.speedscope.app/, select Browse and choose the
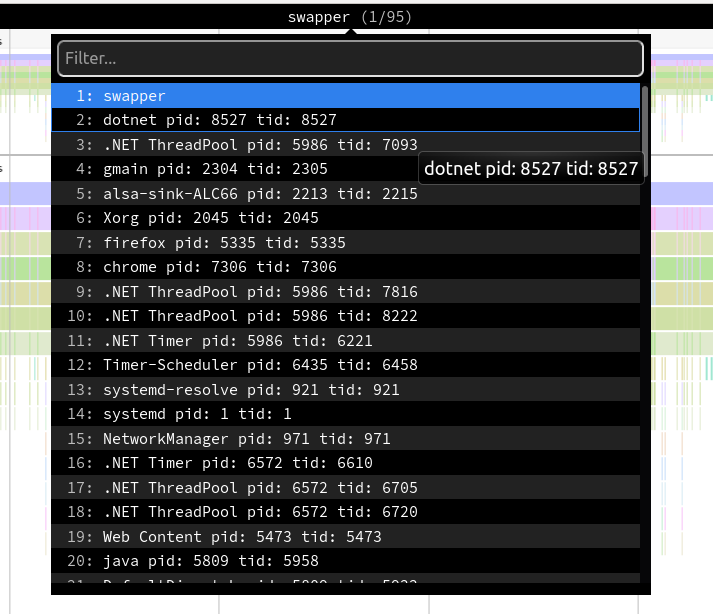
perf.data.txtfile. - perfcollect by default performs machine-wide profiling and speedscope shows only data from one thread at a time. So you need to select the thread from the thread list:
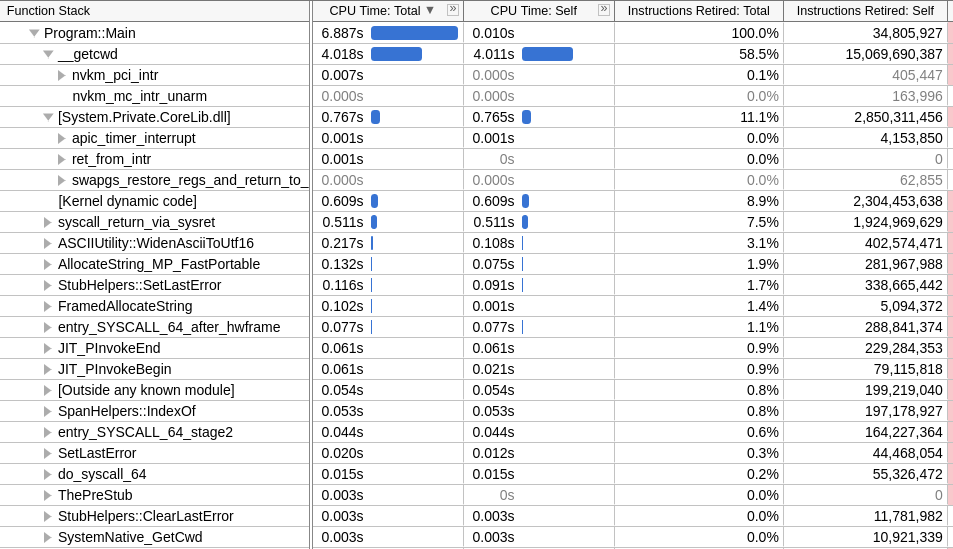
- Now you can just choose on of the tabs, depending on what kind of visualization you prefer. In case you like flamegraphs you can go to “Left Heavy”:
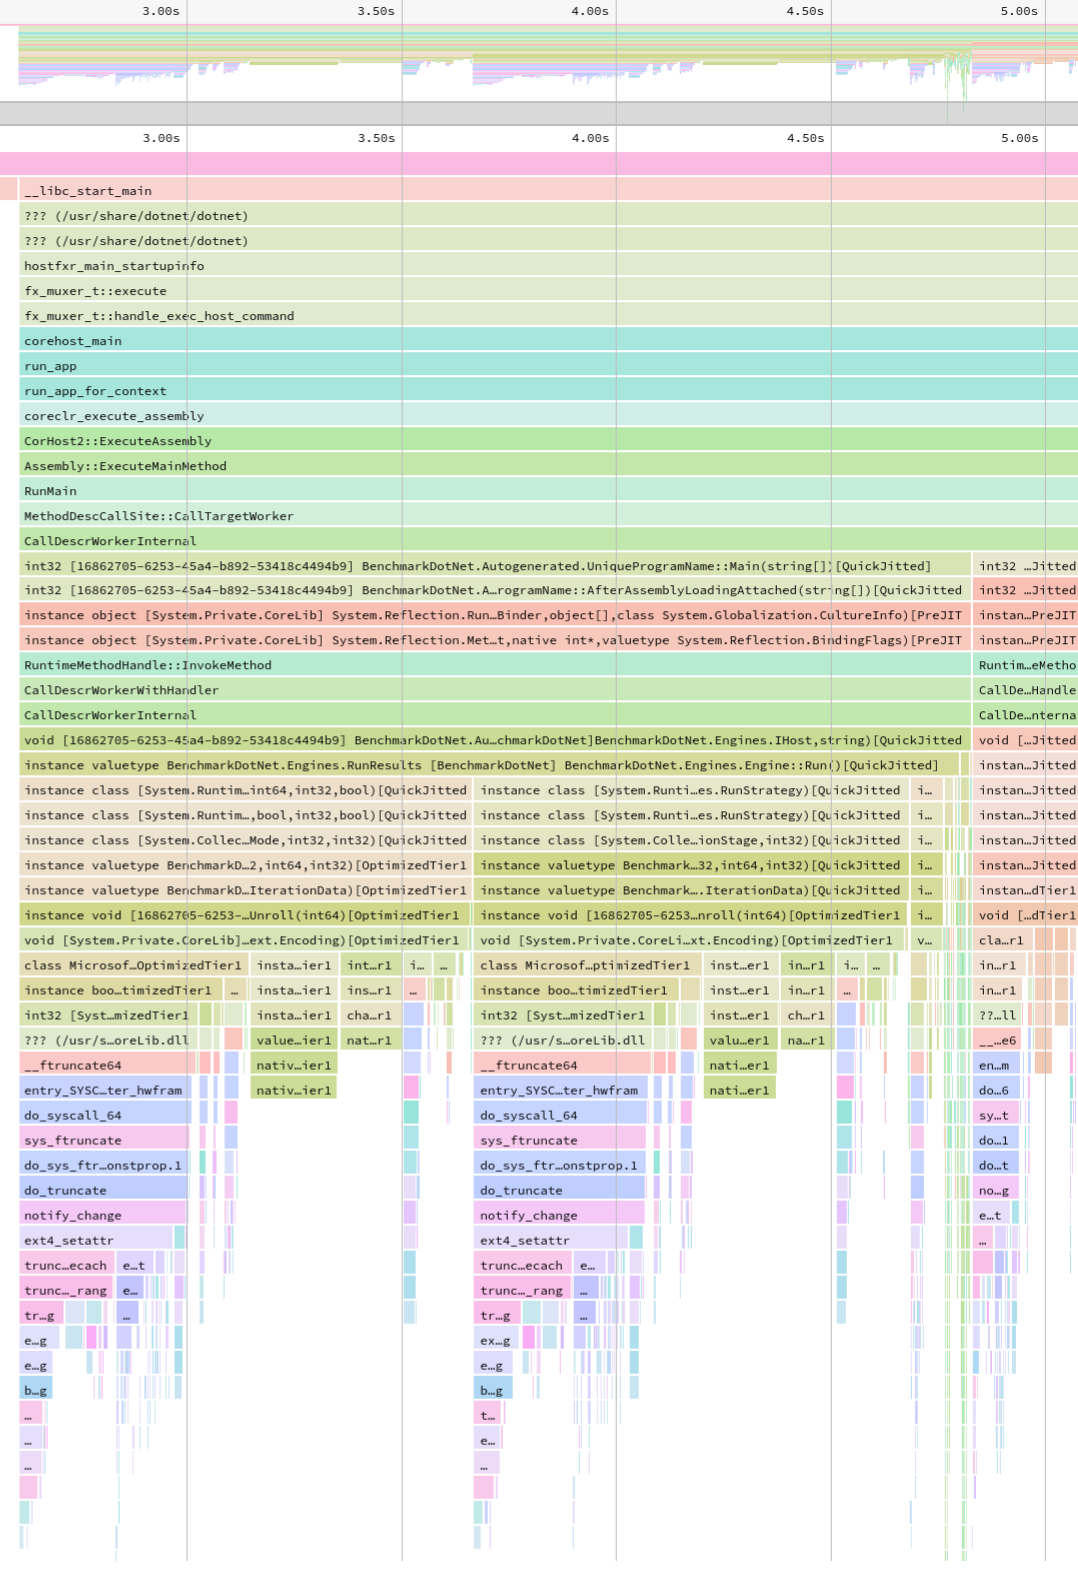
By default, BenchmarkDotNet performs Warmup, Pilot and Overhead phases before starting the actual benchmark workload. Just filter the trace file to actual workload, unless you are interested is cold startup time.
Special Thanks
I wanted to thank:
- Brian Robbins for authoring perfcollect and providing ongoing help.
- Jan Vorlicek for helping me with the investigation and unblocking me.
No blog posts for the last four years
I have not posted anything on this blog for almost four years. I simply lost the motivation, and I am not comfortable speaking in public about the reasons behind it.
But one of the things that makes me very happy is helping animals. Last year I’ve officially become a volunteer in a local animal shelter. My duties are mainly cleaning the cages, feeding the bunnies, and driving them to/from the vet. But I am also helping the shelter financially.
To optimize my impact, I wanted to kindly ask you for a donation for the bunnies. You can do it online via https://pomagam.pl/en/nowyrok-staredlugi website. For translation from polish you can use this google translate link.
If you donate please leave a comment on the donation website, here on my blog, send me an email or tag me on Twitter. I am going to donate the same amount and respond back. To optimize even further I am going to fill in the paperwork and ask my current employer (Microsoft) to donate the same amount I’ve donated (yes, MS offers such a perk!). So, for every dollar you donate, the shelter gets three dollars.
I want to verify what is the best way I can help the shelter: cleaning bunnies cages or sharing my knowledge online and asking for donations.
If you restore my faith in humanity I am going to blog again. Possible topics:
- Cross platform and cross architecture disassembler.
- Startup time performance investigation based on System.CommandLine example.
- The story and reasoning behind improving Sockets performance on Linux in .NET 5.
- Best practices for Fast File IO with .NET.
Thank you, Adam