Sample performance investigation using BenchmarkDotNet and PerfView
Introduction
Part of my job on the .NET Team is to improve the performance of existing .NET libraries. My current goal is to identify performance bottlenecks in ML.NET and recognize common performance issues that should be addressed by .NET framework.
In this blog post, I am describing how I approach sample performance problem using available free .NET tools and best practices for performance engineering.
Benchmark
The first thing I need is a good benchmark which tests the performance of the feature that I care about. By good benchmark, I mean something that measures only the thing that I am interested in and produces accurate, stable and repeatable results.
ML.NET repository has many benchmarks and it’s already using a very good tool for benchmarking (yes, it’s of course BenchmarkDotNet ;) ).
The first thing I do is running all of the real-life scenario benchmarks, order them by time (descending) and importance (based on the info from the manager) and choose top 1.
- Why do I choose only the real-life scenario benchmarks? Because I want to improve the end user experience. I don’t want to improve a micro-benchmark which tests only a piece of the end product.
- Why do I take the most time-consuming benchmark? Because the longer it takes to execute some code, the more performance issues it probably has. I don’t have an infinite amount of time and I want to make an impact.
- Why do I focus on the scenarios pointed by the manager? Because the manager knows what is important for our customers. If I solve a perf issue in a scenario that nobody cares about it’s not worth too much ;)
So in my case the benchmark that I decided to focus on is CV_Multiclass_WikiDetox_WordEmbeddings_OVAAveragedPerceptron which looks like this:
[Benchmark]
public void CV_Multiclass_WikiDetox_WordEmbeddings_OVAAveragedPerceptron()
{
    string cmd = @"CV k=5  data=" + _dataPath_Wiki +
        " tr=OVA{p=AveragedPerceptron{iter=10}}" +
        " loader=TextLoader{quote=- sparse=- col=Label:R4:0 col=rev_id:TX:1 col=comment:TX:2 col=logged_in:BL:4 col=ns:TX:5 col=sample:TX:6 col=split:TX:7 col=year:R4:3 header=+}" +
        " xf=Convert{col=logged_in type=R4}" +
        " xf=CategoricalTransform{col=ns}" +
        " xf=TextTransform{col=FeaturesText:comment tokens=+ wordExtractor=NGramExtractorTransform{ngram=2}}" +
        " xf=WordEmbeddingsTransform{col=FeaturesWordEmbedding:FeaturesText_TransformedText model=FastTextWikipedia300D}" +
        " xf=Concat{col=Features:FeaturesText,FeaturesWordEmbedding,logged_in,ns}";

    using (var environment = EnvironmentFactory.CreateClassificationEnvironment<TextLoader, CategoricalTransform, AveragedPerceptronTrainer>())
    {
        Maml.MainCore(environment, cmd, alwaysPrintStacktrace: false);
    }
}
Profiler
Benchmark can tell me only how long it takes to execute given piece of code. What I also need is a Profiler to find out which methods are being executed and for how long. In my case, I am going to use ETWProfiler which is just a BenchmarkDotNet plugin that uses ETW for profiling.
Run the benchmark before applying any changes
To choose the benchmark I am using --filter option, to use ETWProfiler just --profiler ETW. Moreover I want to store the results in a dedicated folder to be able to compare them later after I apply some improvements. For this purpose I am using --artifacts.
I don’t want the benchmark or profile to include any noise, so I close ALL applications except a single command line window!
And run following command:
dotnet run -c Release -- --filter *WikiDetox_WordEmbeddings_OVAAveragedPerceptron --profiler ETW --artifacts .\BenchmarkDotNet.Artifacts\before
The regular output:
BenchmarkDotNet=v0.11.2, OS=Windows 10.0.17134.345 (1803/April2018Update/Redstone4)
Intel Xeon CPU E5-1650 v4 3.60GHz, 1 CPU, 12 logical and 6 physical cores
Frequency=3507503 Hz, Resolution=285.1031 ns, Timer=TSC
.NET Core SDK=3.0.100-alpha1-009697
  [Host]     : .NET Core 2.1.5 (CoreCLR 4.6.26919.02, CoreFX 4.6.26919.02), 64bit RyuJIT
  Job-OXDQNP : .NET Core 2.1.5 (CoreCLR 4.6.26919.02, CoreFX 4.6.26919.02), 64bit RyuJIT

BuildConfiguration=Release  Toolchain=netcoreapp2.1  IterationCount=1
LaunchCount=3 RunStrategy=ColdStart
| Method | Mean | StdDev |
|---|---|---|
| CV_Multiclass_WikiDetox_WordEmbeddings_OVAAveragedPerceptron | 286.7 s | 5.650 s |
And the path to Trace file with Profile information:
// * Diagnostic Output - EtwProfiler *
Exported 1 trace file(s). Example:
C:\Projects\mldotnet\test\Microsoft.ML.Benchmarks\BenchmarkDotNet.Artifacts\20181109-0426-20620\netcoreapp2.1\Microsoft\ML\Benchmarks\MultiClassClassificationTrain\CV_Multiclass_WikiDetox_WordEmbeddings_OVAAveragedPerceptron.etl
Analysing the Trace File
To analyse the data from the Trace file I am using PerfView, which is a free .NET profiler from Microsoft. If you are not familiar with PerfView you should watch these instructional videos first. These videos were recorded by .NET Performance Architect and PerfView creator - Vance Morisson. Trust me, it’s really worth watching these videos!!!

The first thing I need to do is to open the trace file in PerfView and choose “dotnet –benchmarkName (…)” from CPU Stacks Window (PerfView sorts them descending by CPU consumption):

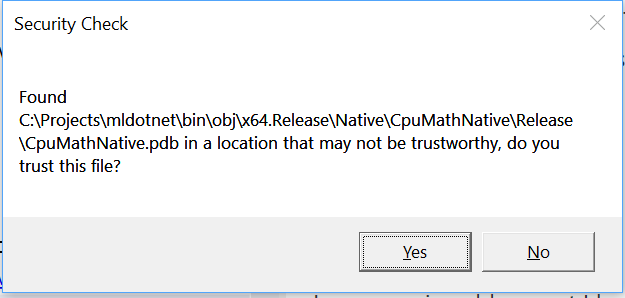
The trace file contains symbols for the managed methods emitted by CLR during CLR Rundown. However, it does not contain the native method symbols. But don’t worry! PerfView noticed that the .pdb file with native symbols is stored on my disk. I have just built this file and I trust it, so I click Yes.
In my previous blog post, I have described how to use PerfView to filter Trace files produced by BenchmarkDotNet to set the time range to the actual benchmark execution. You can read it here. In this particular benchmark, I don’t set the time range because the benchmark is executed just once and moreover I do care about CLR startup. So I am interested in the entire process lifetime. When the benchmark is executed many times I filter the trace to a single benchmark iteration as described in the previous blog post.
Now I go directly to the FlameGraph tab to get some quick overview:
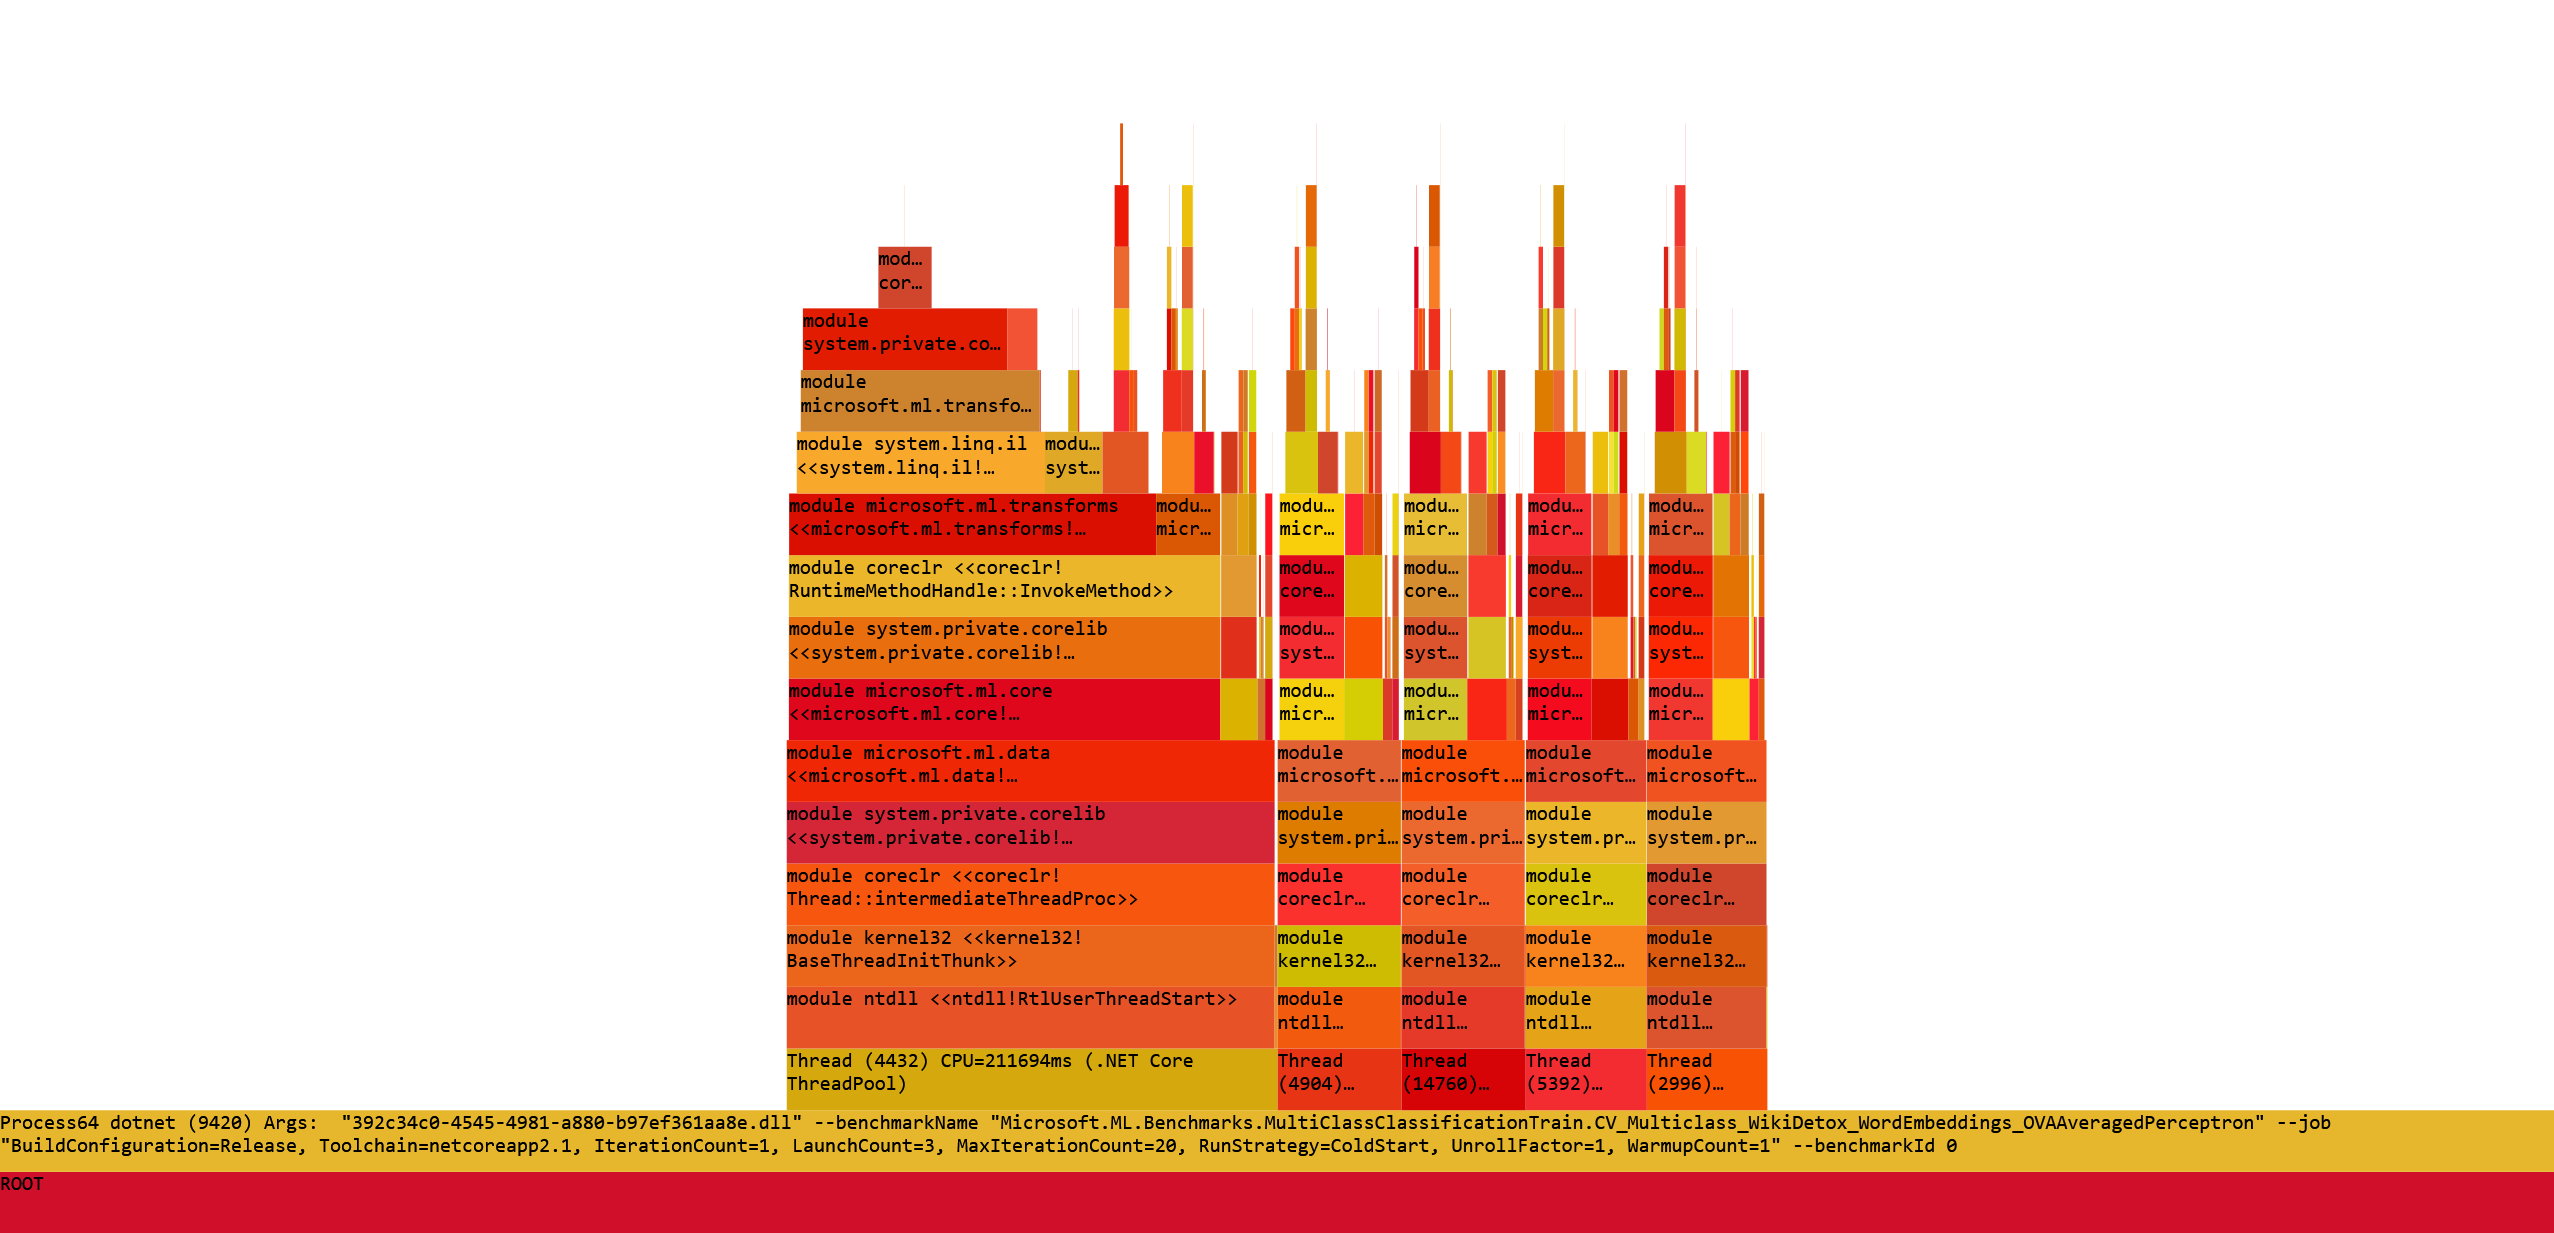
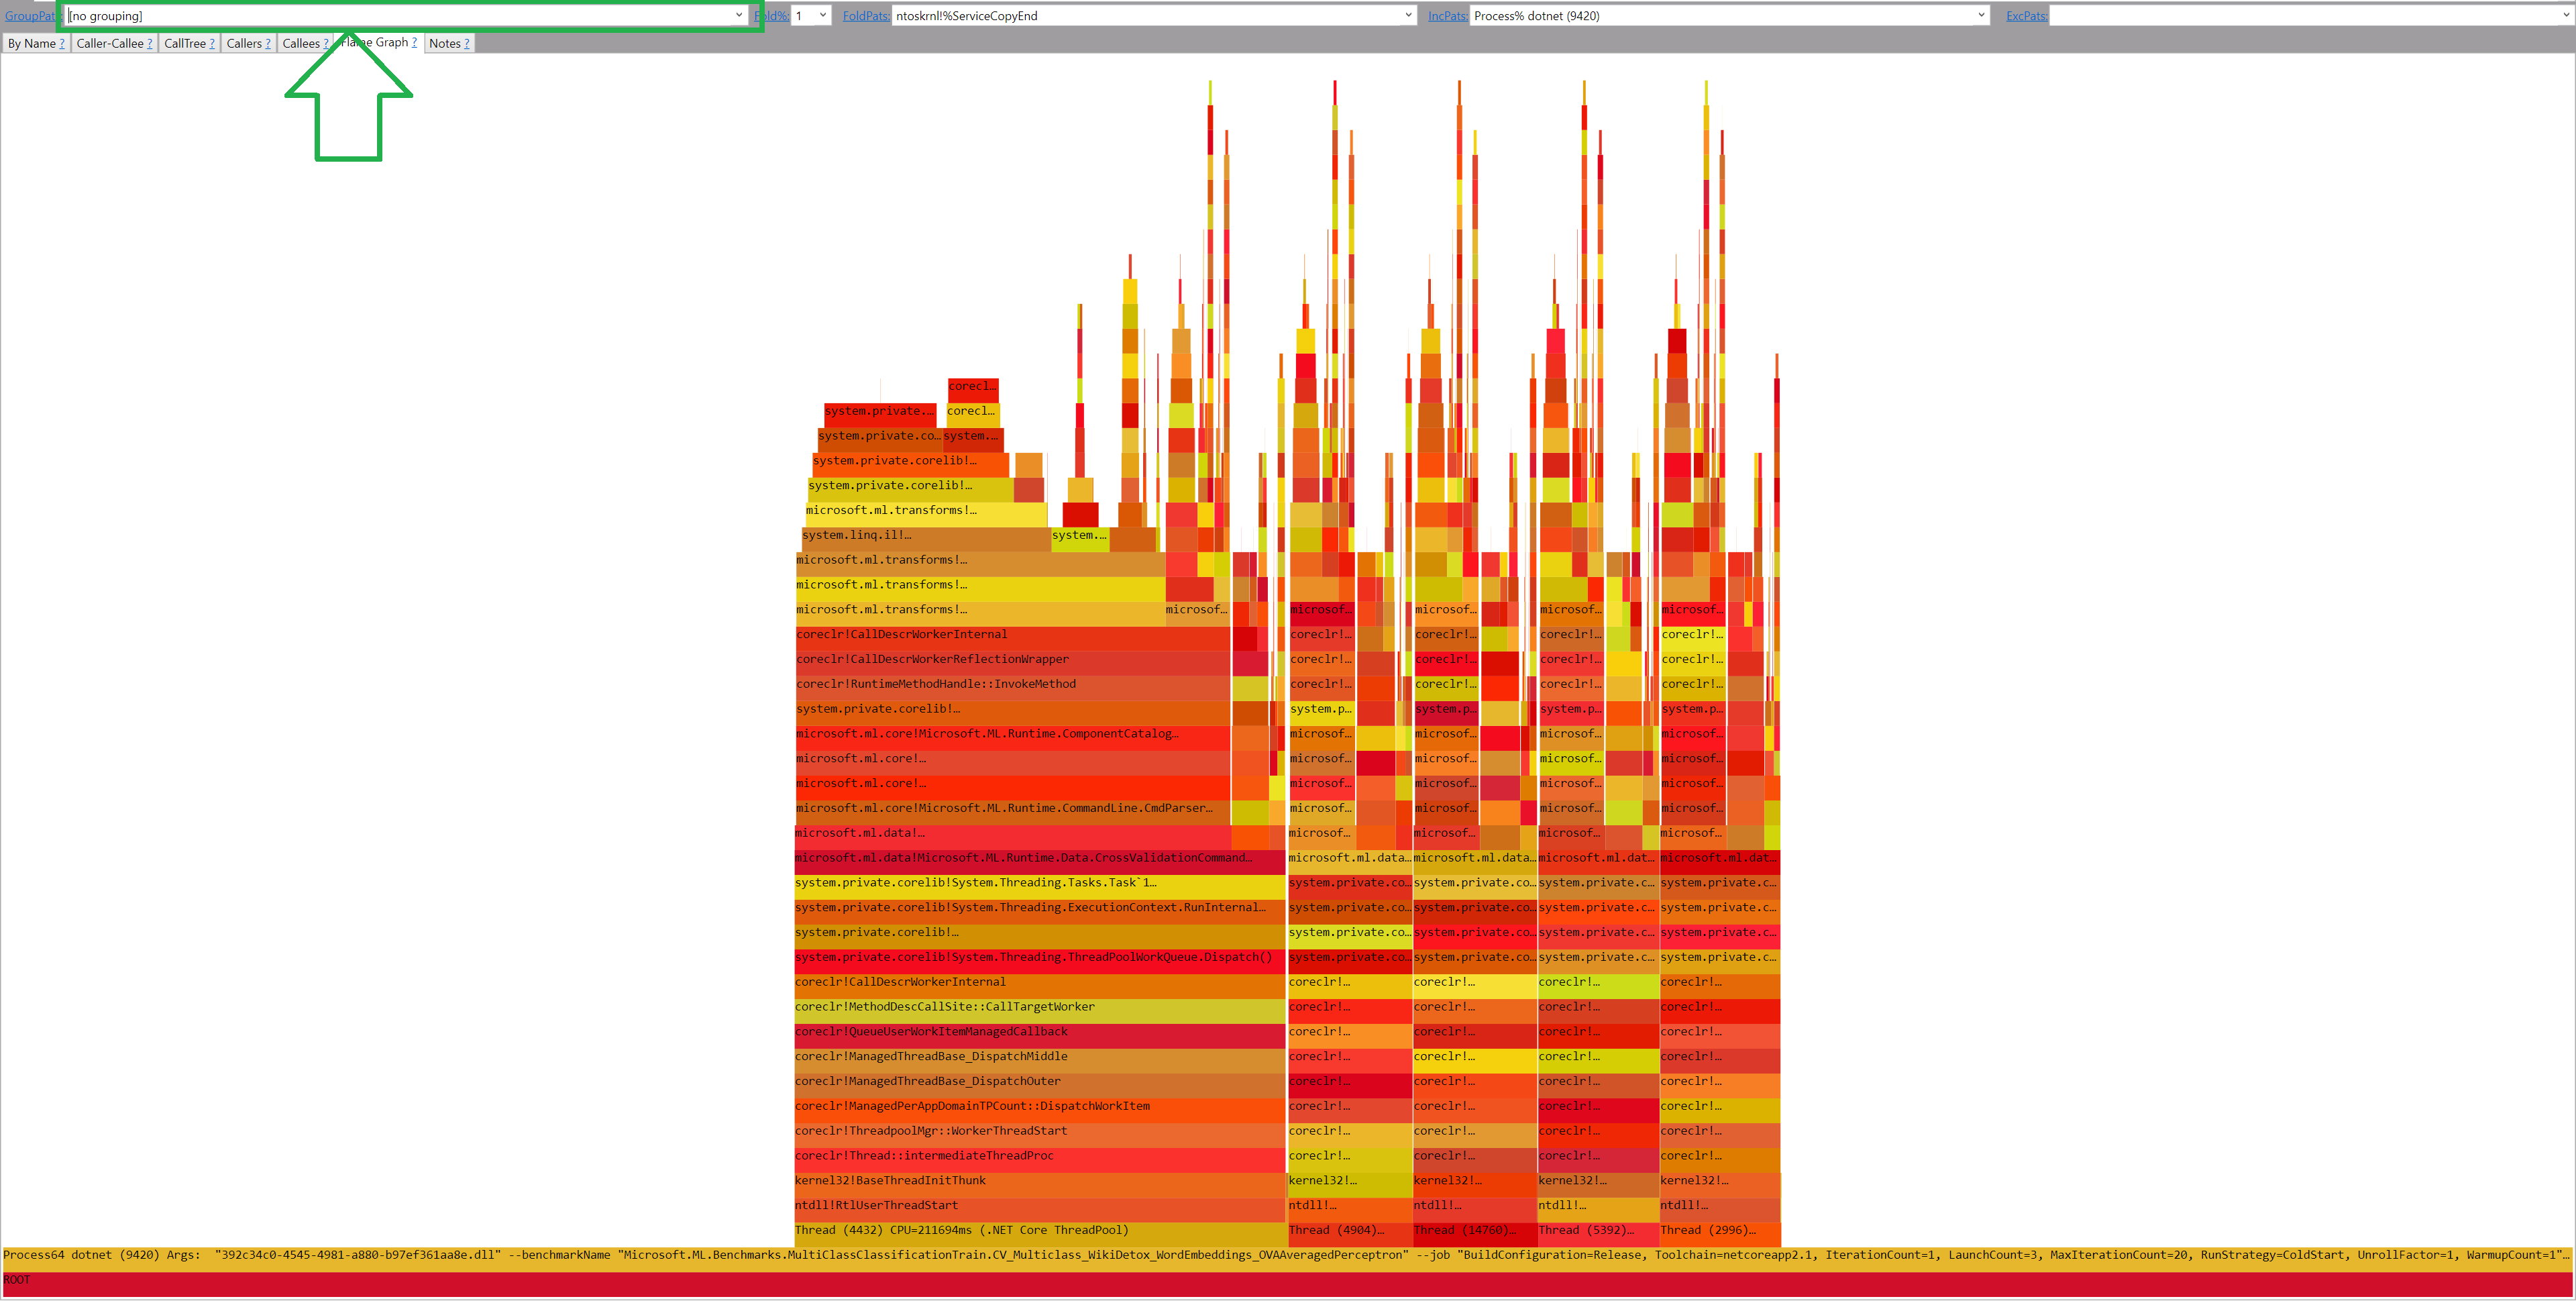
Is it all I need? No! PerfView by default groups the data by modules. I disable the module grouping (GroupPats = [no grouping])
But where is the missing data? Most probably hidden by Folding. So let’s set Fold%=0
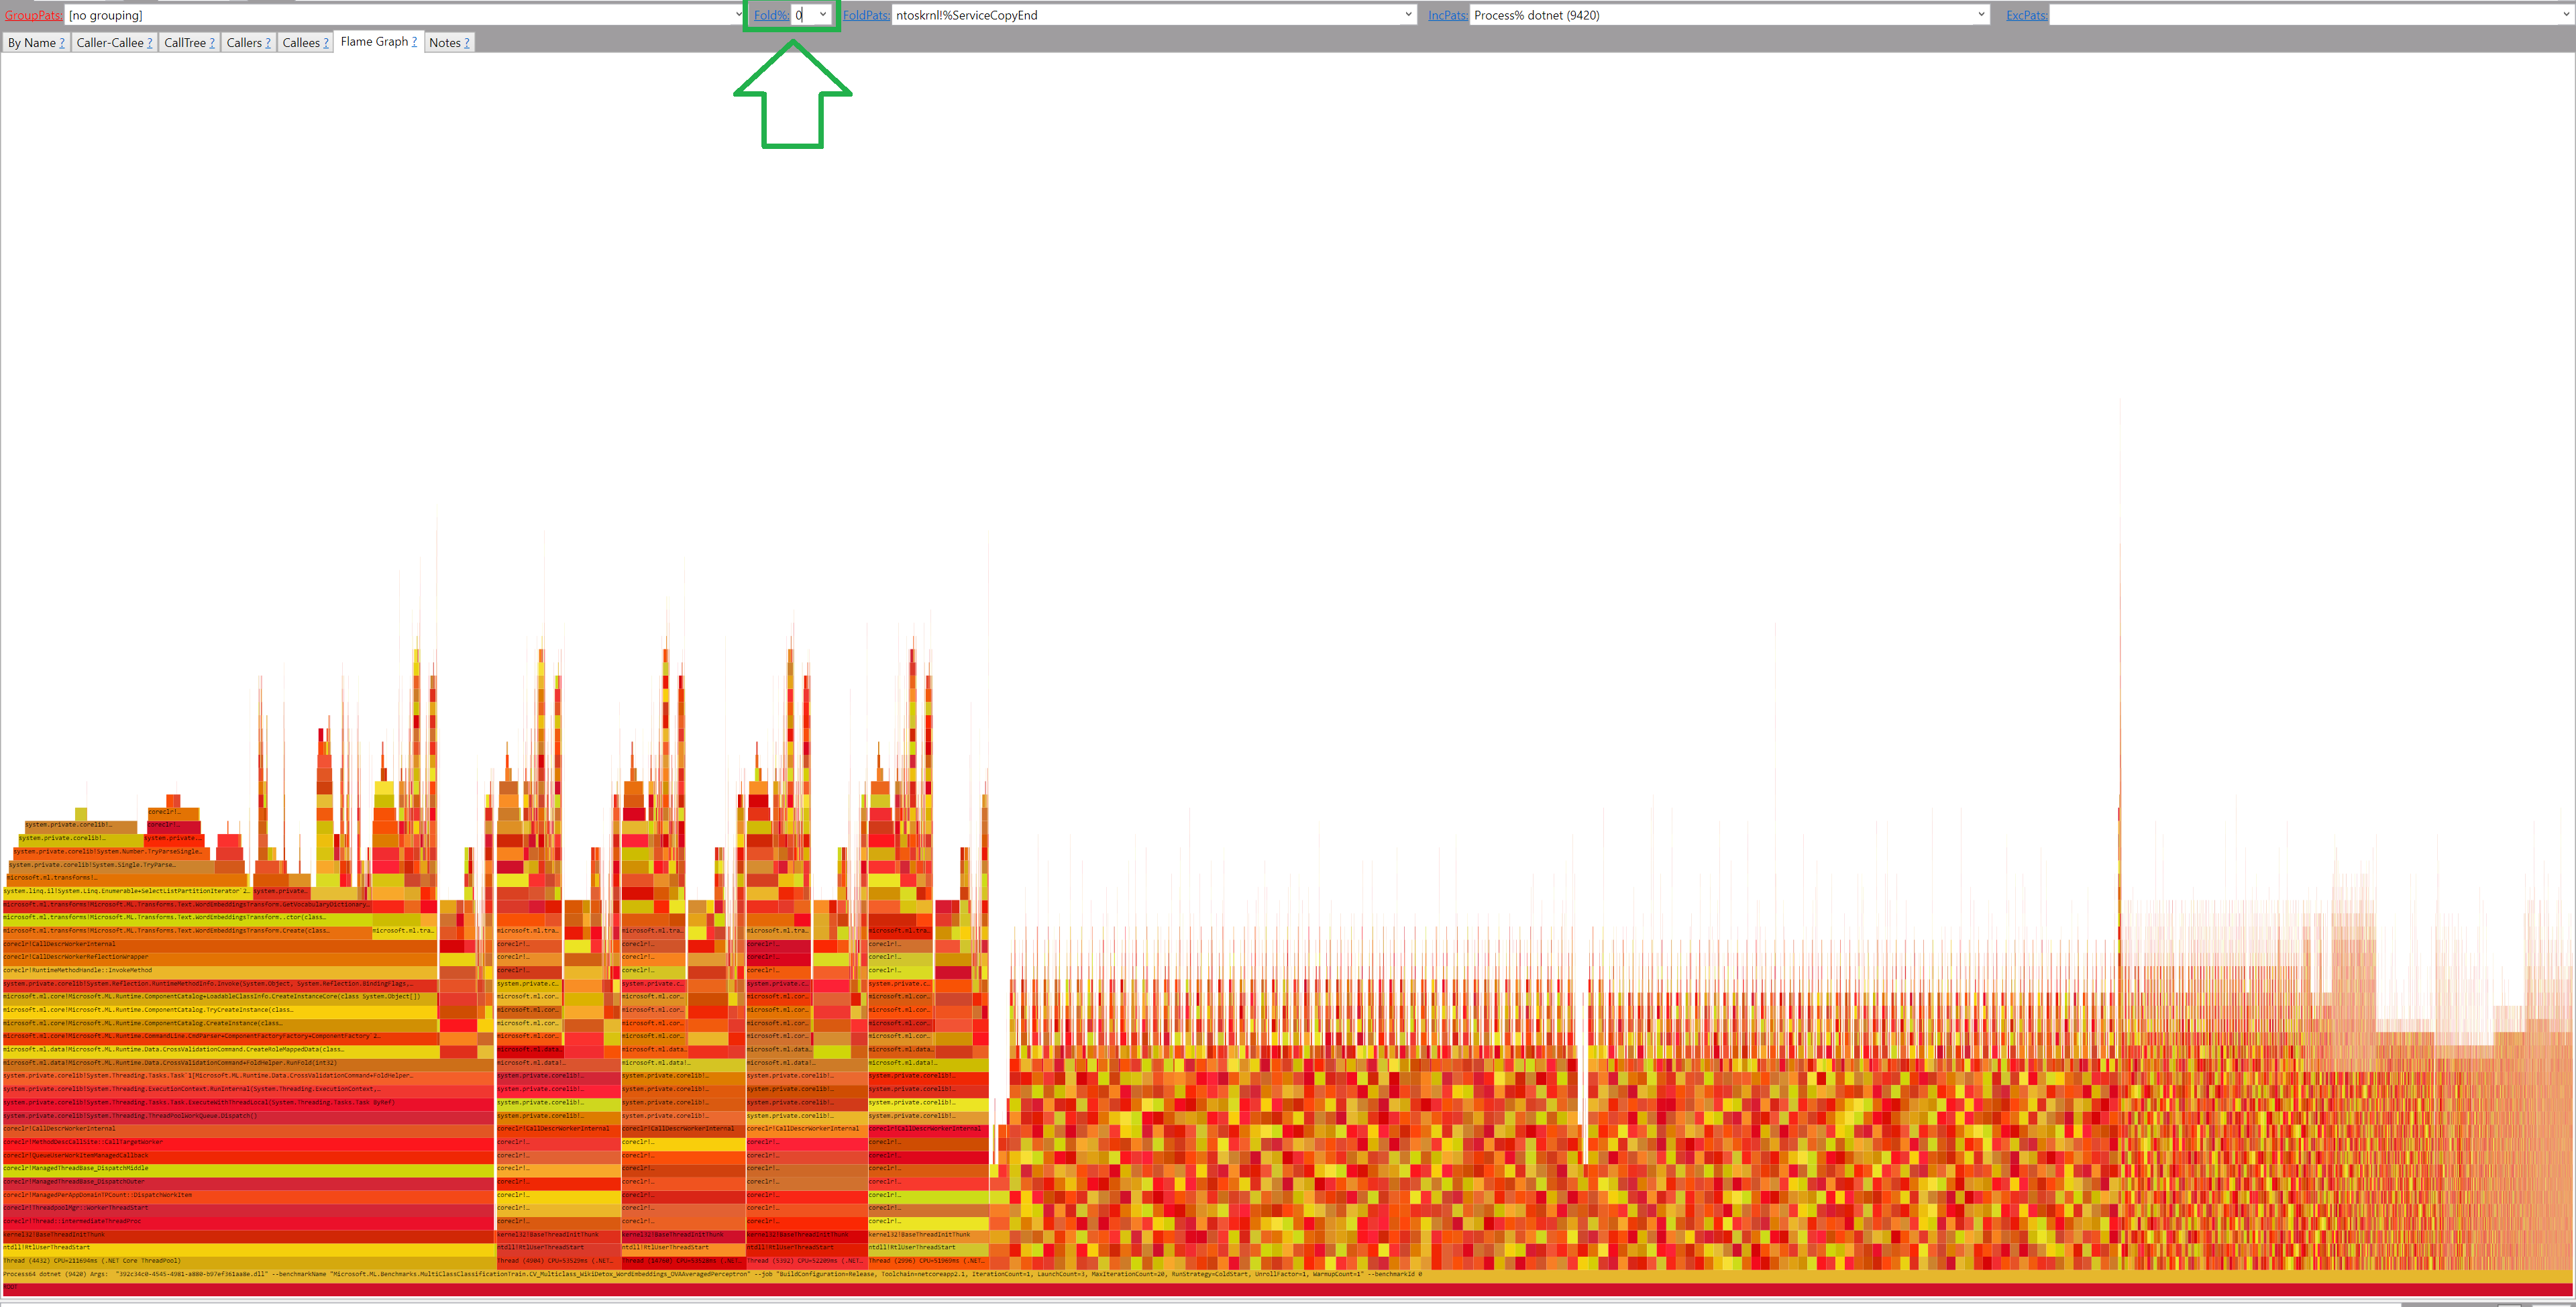
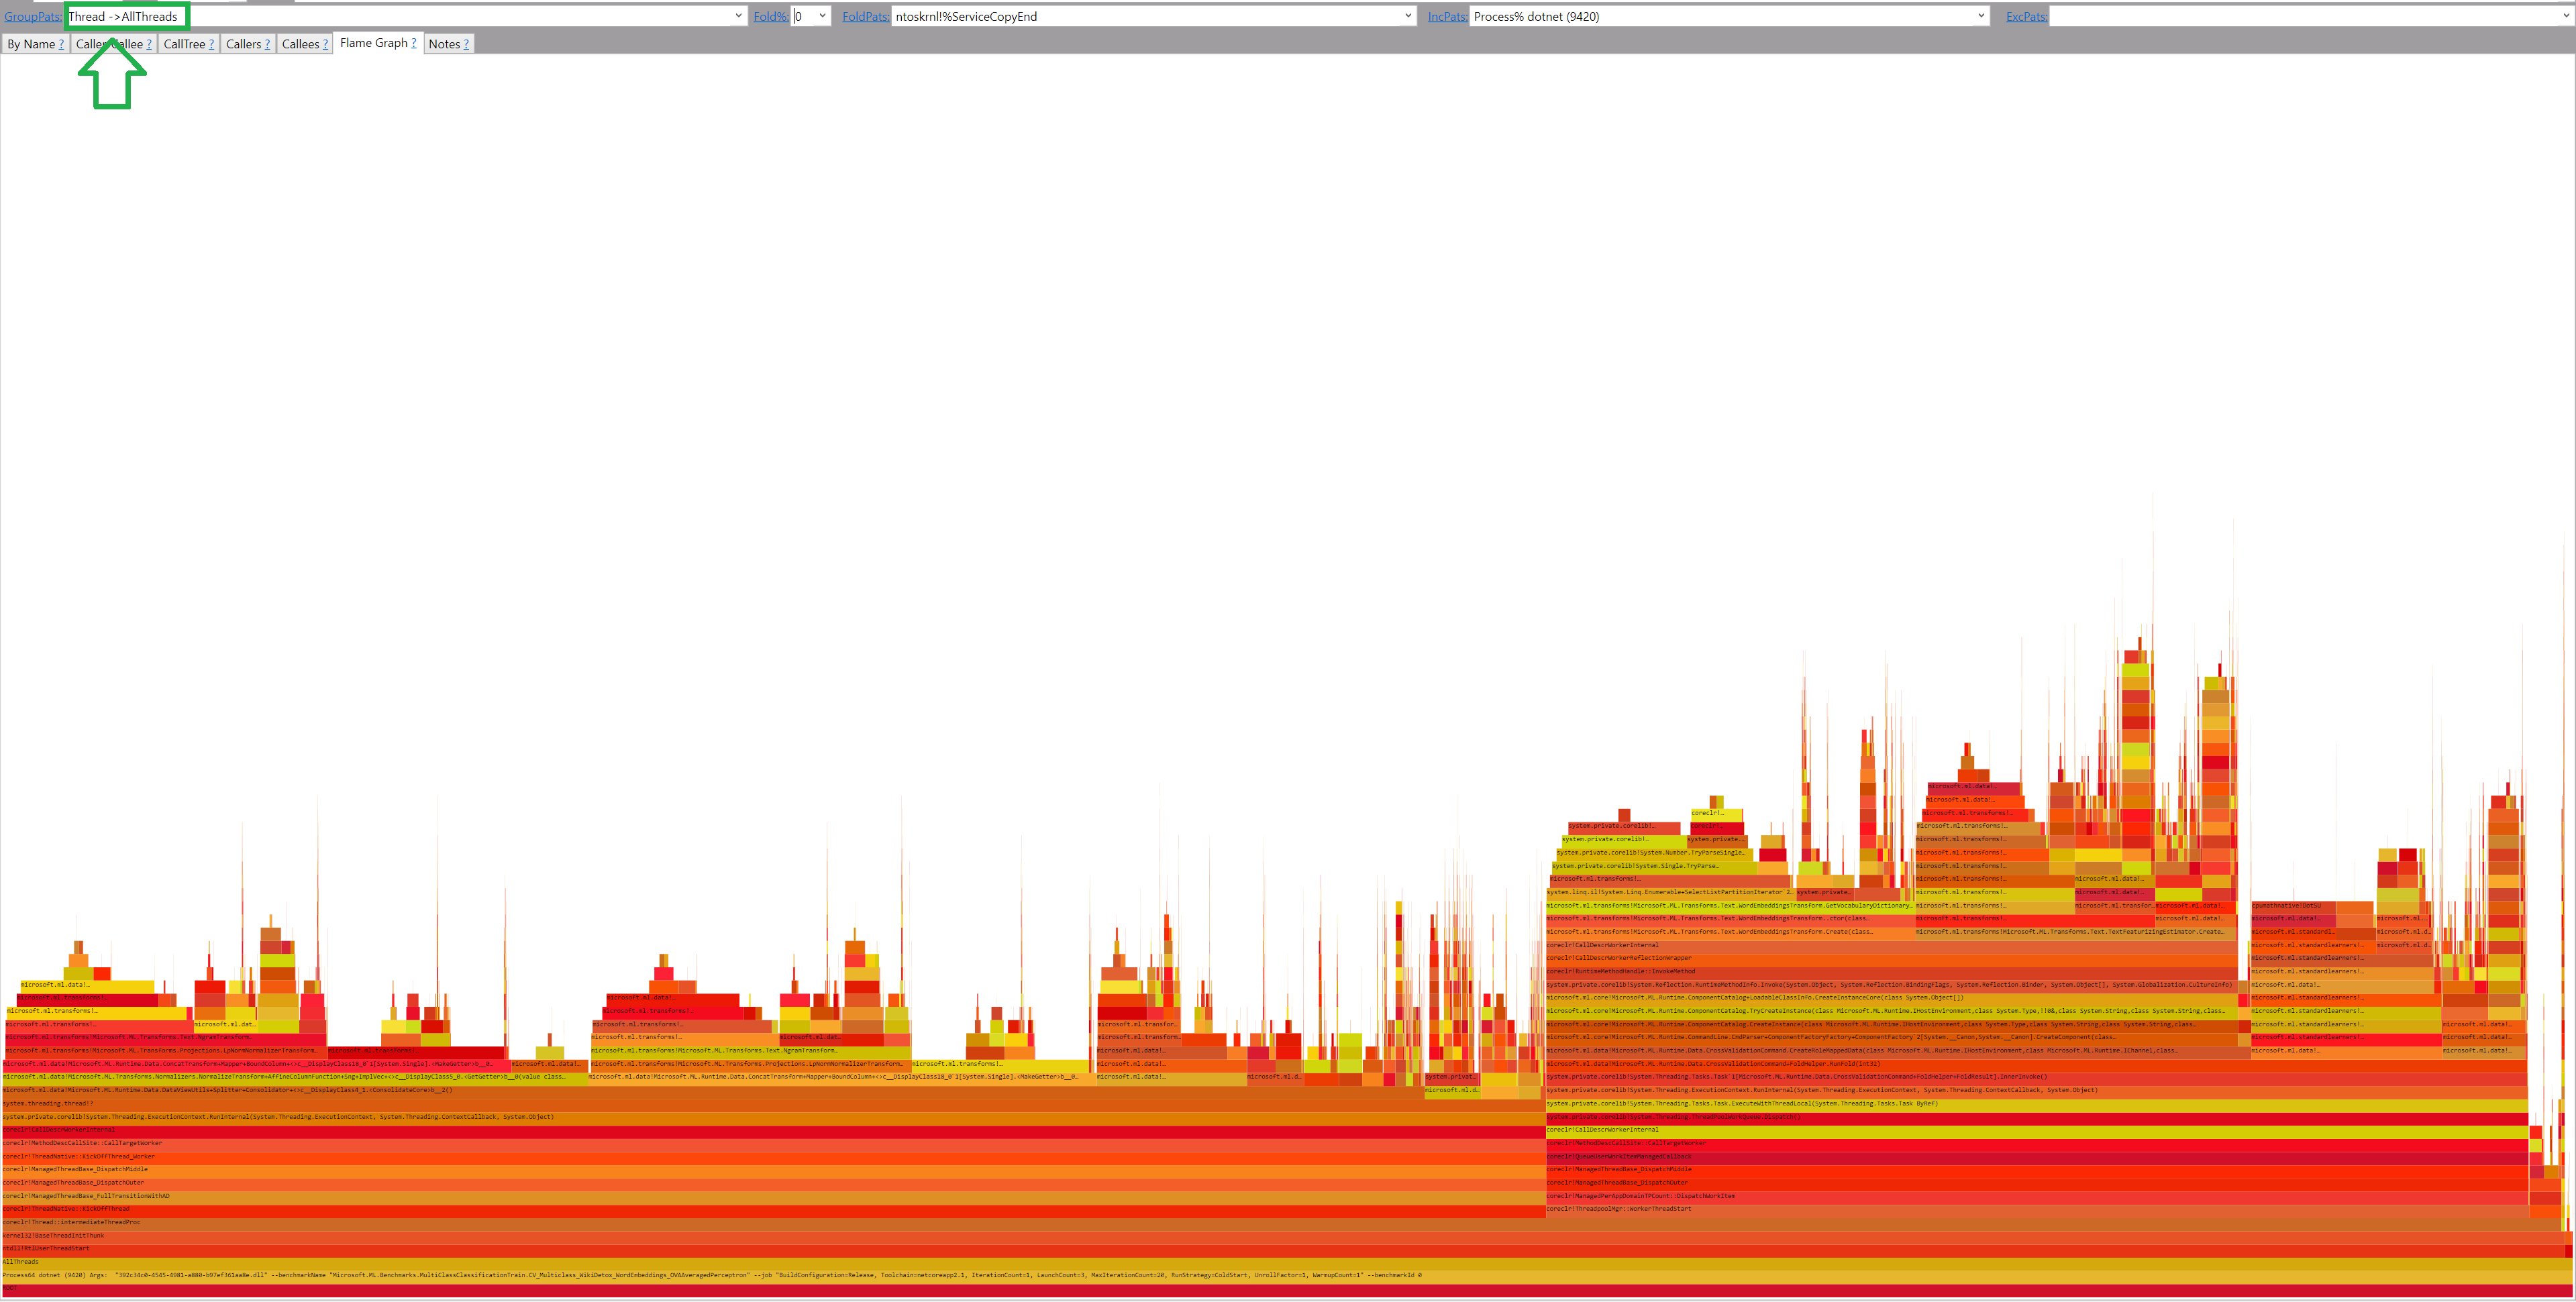
By hovering the mouse over the flame boxes I can see that the code is multi-threaded. And even with Flamegraph, it’s hard to read! So let’s group the data by setting GroupPats = Thread ->AllThreads (mind the spaces!)
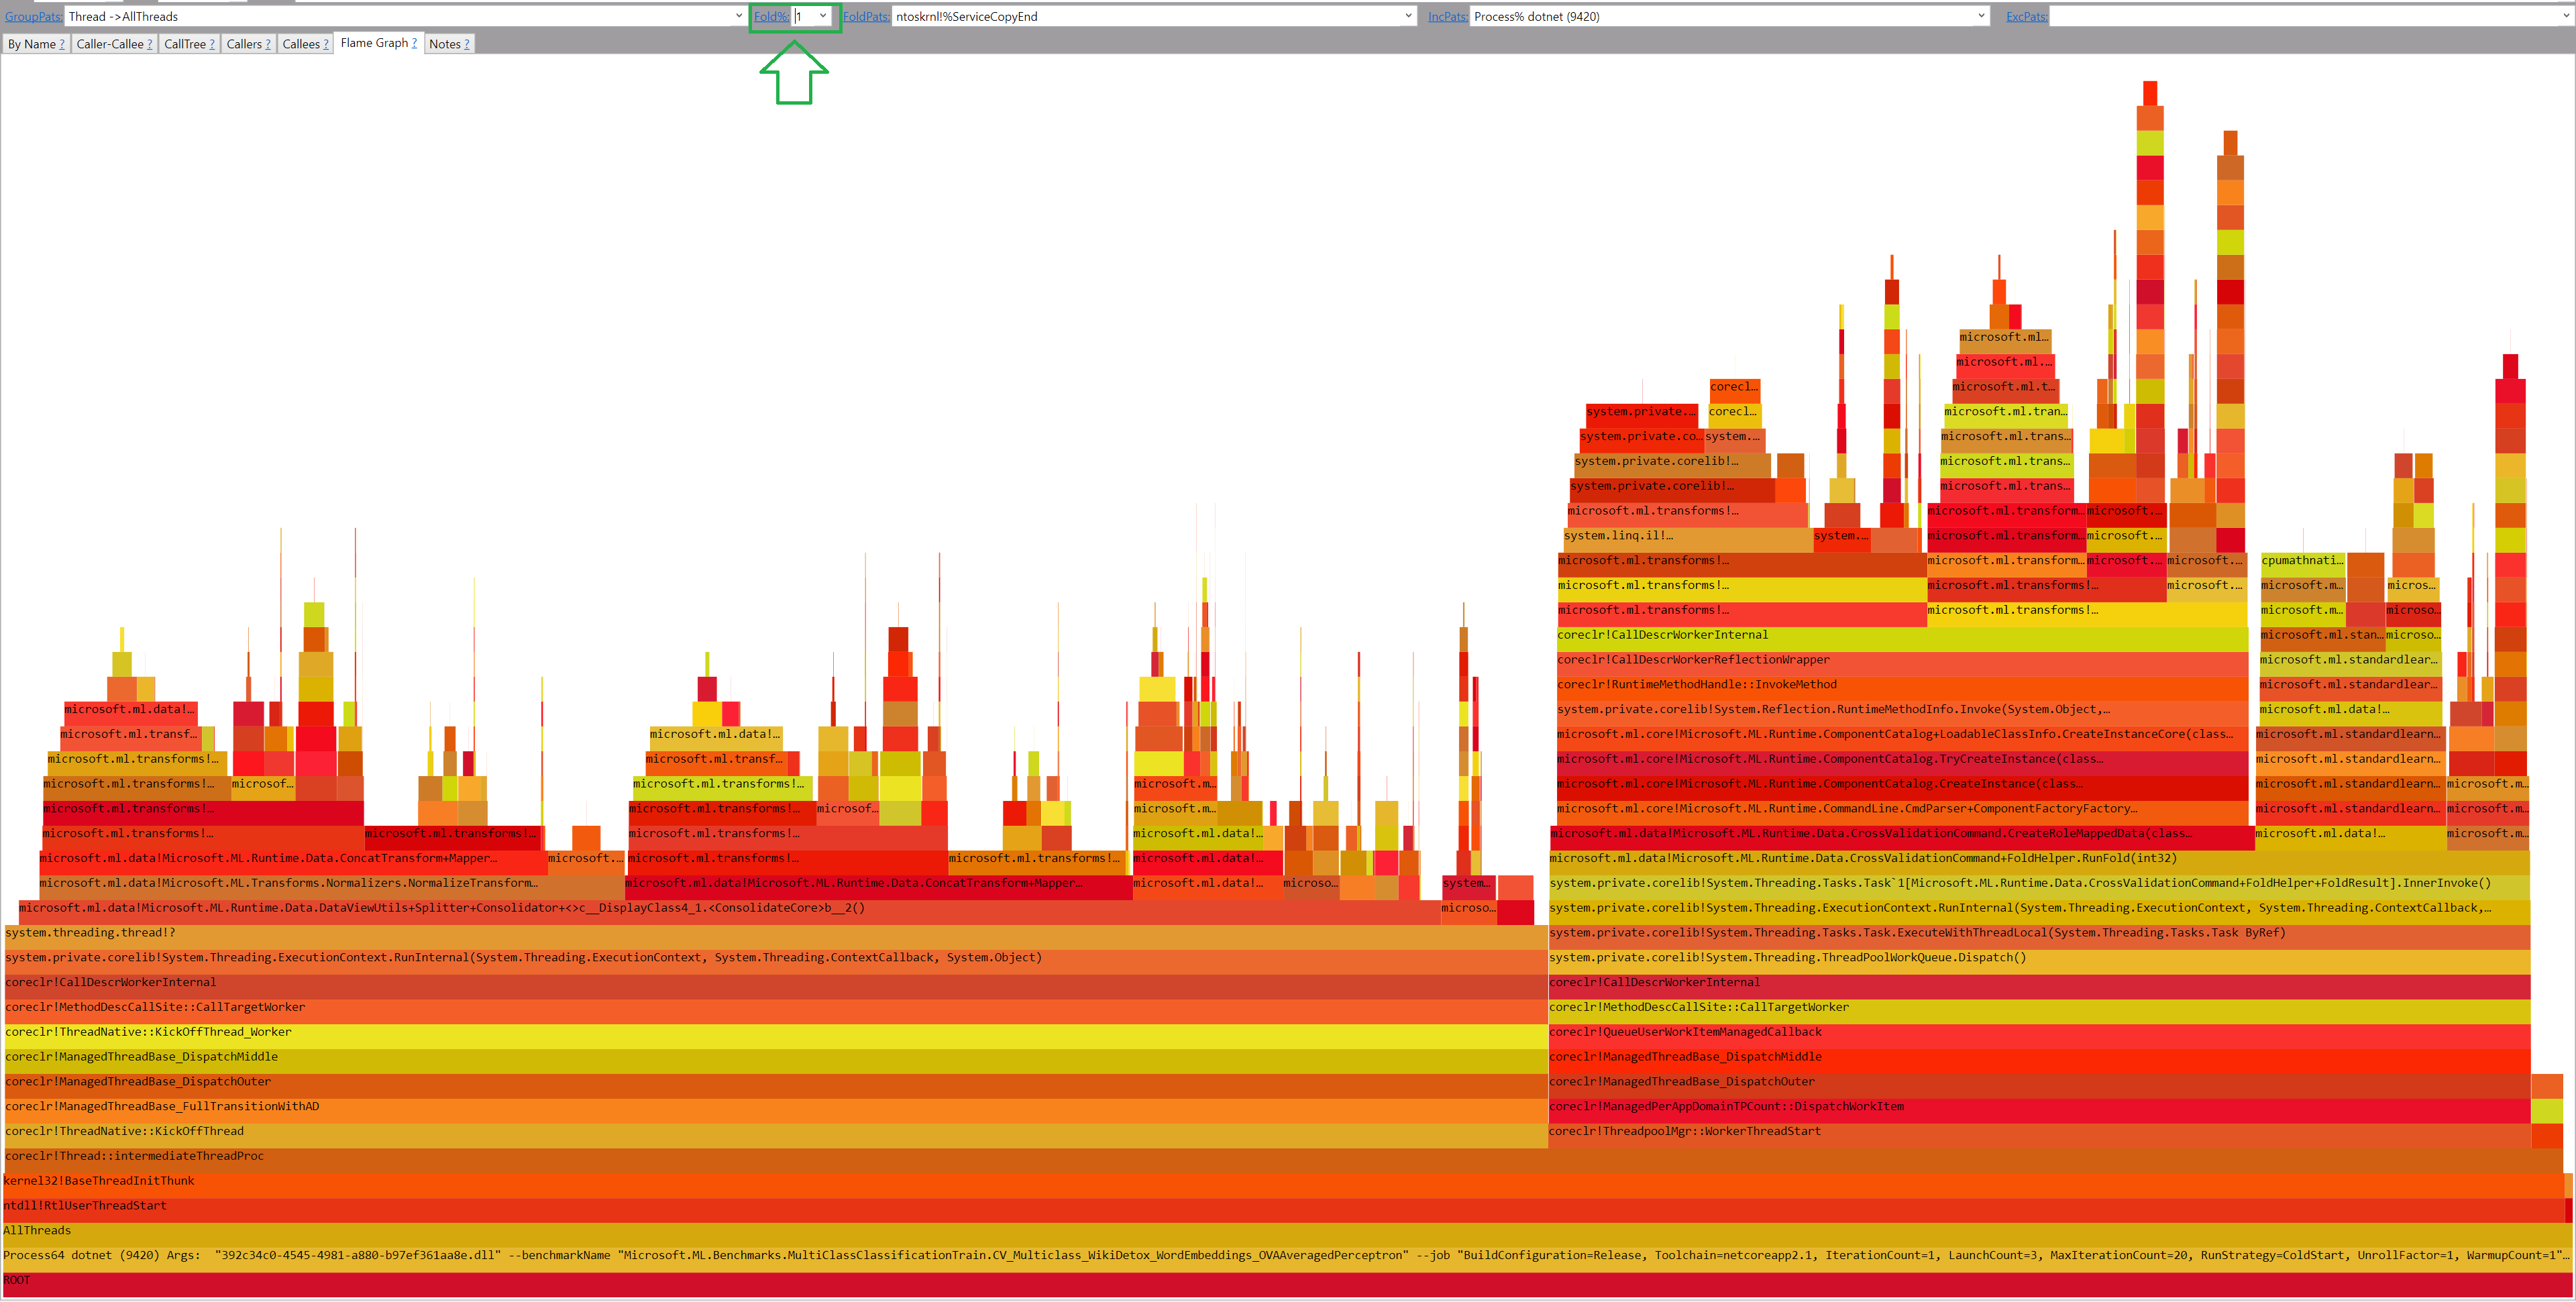
And let’s set folding to 1% again to get it human-friendly:
But as you might notice, some FlameBoxes contain ?! in their names. It means that we need to load the symbols for these methods. The easiest way of doing this is to go to the By name tab, and press Ctrl+A (select all) and then Alt+S (load symbols).
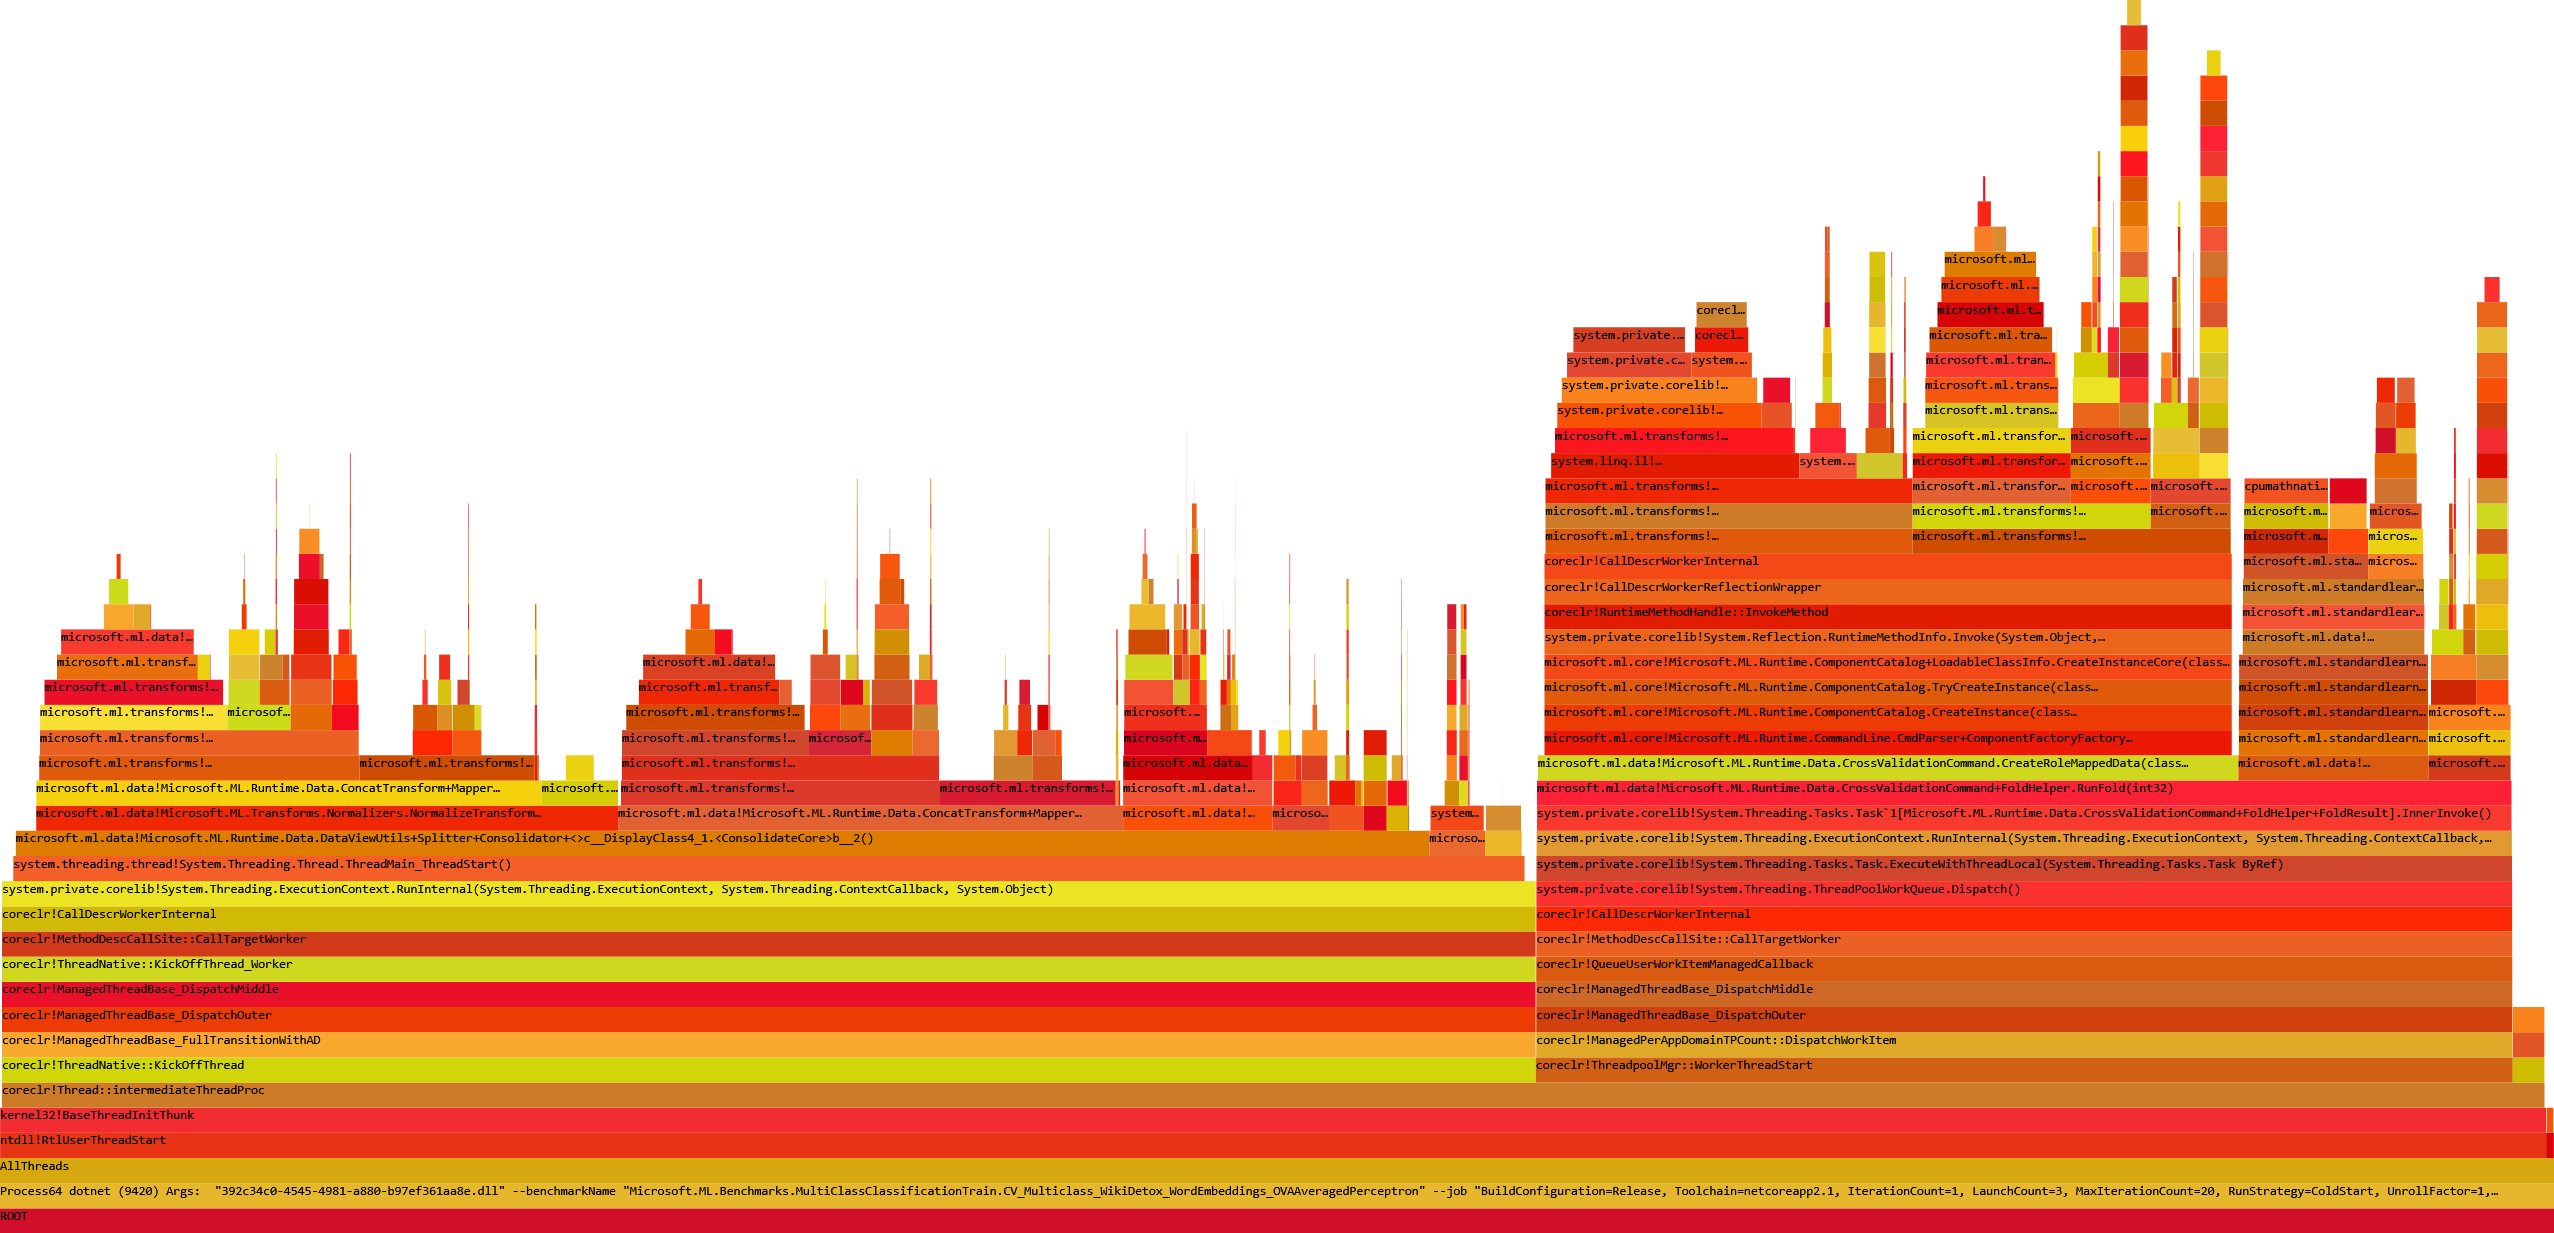
IMHO now I have a very good overview and I can start the analysis!
The Bottleneck
By just looking at the Flamegraph of entire process lifetime I could say that Parsing might be one of my bottlenecks (it’s the biggest box). But it’s not enough to identify a bottleneck.
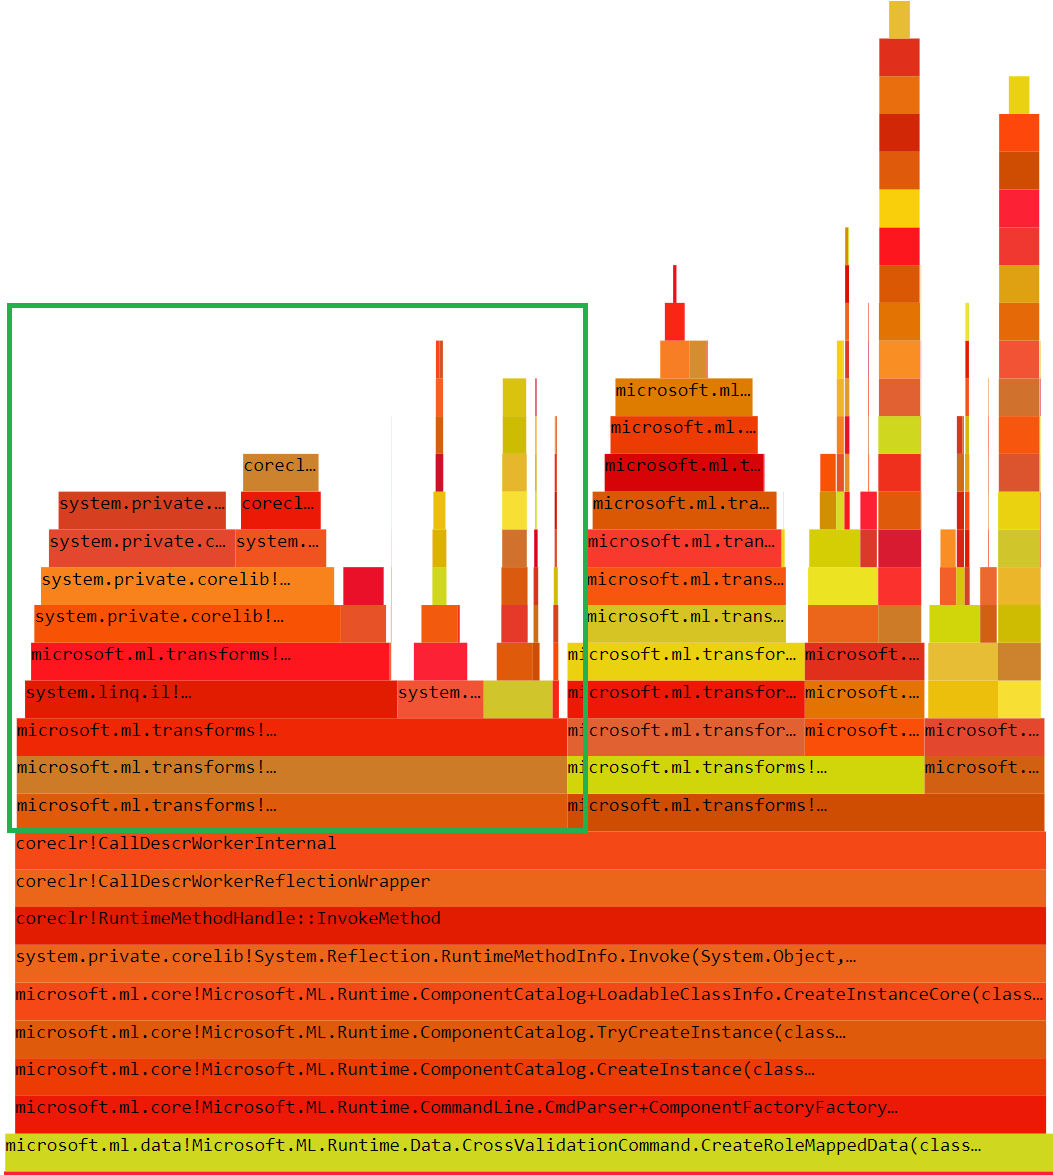
When I switch to the “By name” tab I can see all the methods sorted descending by exclusive time (the ones that does actual computations).

But the most important information is visible in the simple histogram:
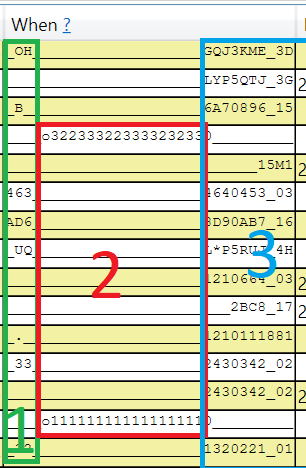
What does this information tell us? That parsing (red block 2) is a performance bottleneck here! Moreover, as you can see, Flamegraph itself gives a great overview but does not tell us about the performance over time. This simple histogram does!
Isolate the bottleneck
The next step is to write a benchmark that isoloates the bottleneck.
In my case it’s following benchmark:
[Benchmark]
public WordEmbeddingsTransform CV_Multiclass_WikiDetox_WordEmbeddings_OVAAveragedPerceptron_JustParse()
{
    string cmd = @"CV k=5  data=" + _dataPath_Wiki +
        " tr=OVA{p=AveragedPerceptron{iter=10}}" +
        " loader=TextLoader{quote=- sparse=- col=Label:R4:0 col=rev_id:TX:1 col=comment:TX:2 col=logged_in:BL:4 col=ns:TX:5 col=sample:TX:6 col=split:TX:7 col=year:R4:3 header=+}" +
        " xf=Convert{col=logged_in type=R4}" +
        " xf=CategoricalTransform{col=ns}" +
        " xf=TextTransform{col=FeaturesText:comment tokens=+ wordExtractor=NGramExtractorTransform{ngram=2}}" +
        " xf=WordEmbeddingsTransform{col=FeaturesWordEmbedding:FeaturesText_TransformedText model=FastTextWikipedia300D}" +
        " xf=Concat{col=Features:FeaturesText,FeaturesWordEmbedding,logged_in,ns}";

    using (var environment = EnvironmentFactory.CreateClassificationEnvironment<TextLoader, CategoricalTransform, AveragedPerceptronTrainer>())
    {
        return new WordEmbeddingsTransform(
            environment,
            modelKind: WordEmbeddingsTransform.PretrainedModelKind.FastTextWikipedia300D,
            new WordEmbeddingsTransform.ColumnInfo("FeaturesText_TransformedText", "FeaturesWordEmbedding"));
    }
}
Now I again turn off everything and run the benchmark with ETWProfiler enabled. The results I get are:
| Method | Mean |
|---|---|
| CV_Multiclass_WikiDetox_WordEmbeddings_OVAAveragedPerceptron_JustParse | 153.0 s |
Analyse the bottlneck profile
After some filtering in PerfView we can see following Flamegraph:

Explanation:
float.TryParse- 56% - it’s the cost of parsing a float, there is very little we can do about it (quickly)NumberFormatInfo.CurrentInfo- 8% - anytime we callfloat.TryParseand not provide theNumberFormatInfothe framework callsNumberFormatInfo.CurrentInfo. We can easily read it once and provide in explicit way to save the 8%.String.Split- 15% - we should not be usingSplitwhen we can do slicing with Span!StreamReader.ReadLine- 12% - it’s the cost of reading a file, there is very little we can do about it (quickly)String.Substring- 1% - again we should not be usingSubstringwhen we can do slicing with Span!
Make sure the code has unit test coverage
Before I apply any optimizations I need to make sure that I have some unit tests to not introduce any new bugs! I don’t know the product well and I don’t want to waste my time for manual testing. Moreover, having a test commited before the changes will make it more likely for the project maintainers to accepty my optimizations in a PR.
So I just write a following test first:
public class LineParserTests
{
    public static IEnumerable<object[]> ValidInputs()
    {
        foreach (var line in new string[]
        {
            "key 0.1 0.2 0.3", "key 0.1 0.2 0.3 ",
            "key\t0.1\t0.2\t0.3", "key\t0.1\t0.2\t0.3\t" // tab can also be a separator
        })
        {
            yield return new object[] { line, "key", new float[] { 0.1f, 0.2f, 0.3f } };
        }
    }

    [Theory]
    [MemberData(nameof(ValidInputs))]
    public void WhenProvidedAValidInputParserParsesKeyAndValues(string input, string expectedKey, float[] expectedValues)
    {
        var result = Transforms.Text.LineParser.ParseKeyThenNumbers(input);

        Assert.True(result.isSuccess);
        Assert.Equal(expectedKey, result.key);
        Assert.Equal(expectedValues, result.values);
    }

    [Theory]
    [InlineData("")]
    [InlineData("key 0.1 NOT_A_NUMBER")] // invalid number
    public void WhenProvidedAnInvalidInputParserReturnsFailure(string input)
    {
        Assert.False(Transforms.Text.LineParser.ParseKeyThenNumbers(input).isSuccess);
    }
}
Writing a test first is a future investment that pays off very quickly! I have never regretted writing a test, but the few times I didn’t write a test I had to pay for it later..
Once I have the tests I move the existing parsing logic to a dedicated method:
public static (bool isSuccess, string key, float[] values) ParseKeyThenNumbers(string line)
{
    char[] delimiters = { ' ', '\t' };
    string[] words = line.TrimEnd().Split(delimiters);
    string key = words[0];
    float[] values = words.Skip(1).Select(x => float.TryParse(x, out var tmp) ? tmp : Single.NaN).ToArray();
    if (!values.Contains(Single.NaN))
        return (true, key, values);

    return (false, null, null);
}
Closer look
Let’s analyse the code from perf perspective line by line:
char[] delimiters = { ' ', '\t' };- the array is alocated every time the method is called. It should be moved to a static readonly field. (in the original code it was allocated once per file so it was not that bad)line.TrimEnd- this method allocates new string if the trimming is requiredSplit(delimiters)- this method allocates an array of strings and the strings themselveswords.Skip(1).Select(x => float.TryParse(x, out var tmp) ? tmp : Single.NaN).ToArray()- every LINQ method allocates an enumerator. MoreoverToArrayallocates entire array. Typically it’s not an issue, but here every cycle matters (we are on a very hot path).values.Contains(Single.NaN)- contains isO(n), it’s not required here. We should just stop whenTryParsereturns false.
Apply the optimizations
If we target .NET Standard 2.0 we can’t use all the methods that accept Span like float.TryParse(ReadOnlySpan<char>) so we just remove the LINQ and move NumberFormatInfo.CurrentInfo outside of the loop:
public static (bool isSuccess, string key, float[] values) ParseKeyThenNumbers(string line)
{
    if (string.IsNullOrWhiteSpace(line))
        return (false, null, null);

    string[] words = line.TrimEnd().Split(_delimiters);

    NumberFormatInfo info = NumberFormatInfo.CurrentInfo; // moved otuside the loop to save  8% of the time
    float[] values = new float[words.Length - 1];
    for (int i = 1; i < words.Length; i++)
    {
        if (float.TryParse(words[i], NumberStyles.Float | NumberStyles.AllowThousands, info, out float parsed))
            values[i - 1] = parsed;
        else
            return (false, null, null); // fail as soon as something is wrong
    }

    return (true, words[0], values);
}
Which gives us following result:
| Method | Mean |
|---|---|
| CV_Multiclass_WikiDetox_WordEmbeddings_OVAAveragedPerceptron_JustParse | 141.0 s |
Which is exactly the 8% we saved by moving NumberFormatInfo.CurrentInfo outside of the loop. I am not happy about the fact that I had to use such trick to make it faster, so I reported an issue in the JIT repo.
However, with .NET Standard 2.1 or just .NET Core 2.1+ we can take full advantage of Span!
public static (bool isSuccess, string key, float[] values) ParseKeyThenNumbers(string line)
{
    if (string.IsNullOrWhiteSpace(line))
        return (false, null, null);

    ReadOnlySpan<char> trimmedLine = line.AsSpan().TrimEnd(); // TrimEnd creates a Span, no allocations

    int firstSeparatorIndex = trimmedLine.IndexOfAny(' ', '\t'); // the first word is the key, we just skip it
    ReadOnlySpan<char> valuesToParse = trimmedLine.Slice(start: firstSeparatorIndex + 1);

    int valuesCount = 0; // we count the number of values first to allocate a single array with of proper size
    for (int i = 0; i < valuesToParse.Length; i++)
        if (valuesToParse[i] == ' ' || valuesToParse[i] == '\t')
            valuesCount++;

    float[] values = new float[valuesCount + 1]; // + 1 because the line is trimmed and there is no whitespace at the end
    int textStart = 0;
    int valueIndex = 0;
    NumberFormatInfo info = NumberFormatInfo.CurrentInfo; // moved otuside the loop to save  8% of the time
    for (int i = 0; i <= valuesToParse.Length; i++)
    {
        if (i == valuesToParse.Length || valuesToParse[i] == ' ' || valuesToParse[i] == '\t')
        {
            var toParse = valuesToParse.Slice(textStart, i - textStart);

            if (float.TryParse(toParse, NumberStyles.Float | NumberStyles.AllowThousands, info, out float parsed))
                values[valueIndex++] = parsed;
            else
                return (false, null, null);

            textStart = i + 1;
        }
    }

    return (true, new string(trimmedLine.Slice(0, firstSeparatorIndex)), values);
}
Which gives us following result:
| Method | Mean |
|---|---|
| CV_Multiclass_WikiDetox_WordEmbeddings_OVAAveragedPerceptron_JustParse | 129.1 s |
- Does the code look cleaner? No! It’s harder to understand what it does. I have sacrificed readability for performance only because the gain was worth it. I don’t do it by default in every place of our app. You also should not.
- Does it produce correct results! Yes, I have unit tests which test the correctness.
Utf8Parser
The code sample with Span looks really complicated.. It would be nice if .NET could provide some primitives to help with such scenarios. The good news is that .NET Core 2.1 has introduced a new type called Utf8Parser. Honestly, I forgot about its existence, but my teammate Tanner reminded me of that in code review. Thank you Tanner!
Using Utf8Parser simplifies my code a lot:
internal static (bool isSuccess, string key, float[] values) ParseKeyThenNumbers(ReadOnlySpan<byte> line)
{
    if (line.IsEmpty)
        return (false, null, null);

    int firstSeparatorIndex = line.IndexOfAny((byte)' ', (byte)'\t'); // the first word is the key, we just skip it
    ReadOnlySpan<byte> valuesToParse = line.Slice(start: firstSeparatorIndex + 1);

    float[] values = AllocateFixedSizeArrayToStoreParsedValues(valuesToParse);

    int toParseStartIndex = 0;

    for (int valueIndex = 0; valueIndex < values.Length; valueIndex++)
    {
        if (!Utf8Parser.TryParse(valuesToParse.Slice(start: toParseStartIndex), out float parsed, out int bytesConsumed))
            return (false, null, null);

        values[valueIndex] = parsed;
        toParseStartIndex += bytesConsumed + 1; // + 1 is for the whitespace!
    }

    return (true, Encoding.UTF8.GetString(line.Slice(0, firstSeparatorIndex)), values);
}

/// <summary>
/// we count the number of values first to allocate a single array with of proper size
/// </summary>
[MethodImpl(MethodImplOptions.AggressiveInlining)]
private static float[] AllocateFixedSizeArrayToStoreParsedValues(ReadOnlySpan<byte> valuesToParse)
{
    int valuesCount = 0;

    for (int i = 0; i < valuesToParse.Length; i++)
        if (valuesToParse[i] == ' ' || valuesToParse[i] == '\t')
            valuesCount++;

    return new float[valuesCount];
}
What’s next?
Let’s take a look at the Flamegraph of our optimized method. We have:
float.TryParse- there is not really much we can do here without big changesStreamReader.ReadLine- same as above

Are we done here? NO! Two minutes to parse a 6 GB text file is still too much. What can we do when we can’t optimize the single-threaded code any further? We parallelize it!
Parallel
After we squeeze the single-threaded code we can parallelize it. With System.Threading.Tasks.Parallel* and System.Collections.Concurrent* it’s really easy!
Before (some parts omitted for brevity):
using (StreamReader sr = File.OpenText(_modelFileNameWithPath))
{
    while ((line = sr.ReadLine()) != null)
    {
        (bool isSuccess, string key, float[] values) = LineParser.ParseKeyThenNumbers(line);

        if (isSuccess)
            model.AddWordVector(ch, key, values);
    }
}
After (again some parts omitted for brevity):
var parsedData = new ConcurrentBag<(string key, float[] values, long lineNumber)>();

Parallel.ForEach(File.ReadLines(_modelFileNameWithPath),
    (line, parallelState, lineNumber) =>
    {
        (bool isSuccess, string key, float[] values) = LineParser.ParseKeyThenNumbers(line);

        if (isSuccess)
            parsedData.Add((key, values, lineNumber));
    });

foreach (var parsedLine in parsedData.OrderBy(parsedLine => parsedLine.lineNumber))
    model.AddWordVector(ch, parsedLine.key, parsedLine.values);
And the new results with x3 speedup:
| Method | Mean |
|---|---|
| CV_Multiclass_WikiDetox_WordEmbeddings_OVAAveragedPerceptron_JustParse | 39.89 s |
Important:
- I have used specialized Concurrent collection here that allows me to add items in a thread-safe way without locks. Adding manual synchronization would ruin the performance. Do use ConcurrentCollections, try to avoid using locks whenever you can!
- The order of lines is important so after processing entire file I am ordering the elements by the line number and then adding to the model. I did not know that, but the existing unit test reminded me of that very quickly ;)
- I did not want to create any extra memory pressure for the GC so I have used
ValueTuplerepresented as(bool isSuccess, string key, float[] values).ValueTupleis a Value Type, you can read my previous blog post to learn more.
Time to send a PR
ML.NET is evolving very quickly over the time. I definitely don’t want to have a long living branch with many optimizations and solve merge conflicts every day, so I just create one PR per one optimization. A small PR is also easier to review. And if I introduce a new bug it’s easier to find the single change that caused it.
Before I create the PR I also remove the temporary benchmark for file parsing bottleneck. Other benchmarks include it in the execution path and it takes a lot of time to run it. I want to keep the benchmark suite focused on ML.NET, without duplicates and with a short time to run entire suite.
If your benchmarks suite contains duplicates and it takes a LOT of time to execute all of the benchmarks the developers stop using it. You need to keep it simple and focused. My personal recommendation is that it should not take longer than a lunch break to run all of the benchmarks. Why? If I apply some changes I just run the benchmarks before I go to lunch and when I am back I have the results.
If it’s hard to run the benchmarks or it takes too long you can’t expect the developers to run the benchmarks and care for performance.
Summary
- Do NOT try to guess what is the performance issue.
- DO write tests first to save time and avoid introducing new bugs.
- DO use a profiler to find out where the issues are.
- DO use benchmarks to measure the improvements and compare different approaches.
- Do NOT reinvent the wheel, .NET Framework most probably already have what you need.
Before:
| Method | Mean |
|---|---|
| WikiDetox_WordEmbeddings_OVAAveragedPerceptron | 286.7 s |
| WikiDetox_WordEmbeddings_SDCAMC | 184.1 s |
After:
| Method | Mean |
|---|---|
| WikiDetox_WordEmbeddings_OVAAveragedPerceptron | 174.24 s |
| WikiDetox_WordEmbeddings_SDCAMC | 67.82 s |
In my next blog post I am going to use Concurrency Visualizer for Visual Studio to continue this investigation until I get 100% CPU consumption on all Cores for processing this huge Utf8 text file.